Oxidative stress by tumor-derived macrophages suppresses the expression of CD3 zeta chain of T-cell receptor complex and antigen-specific T-cell responses - PubMed (original) (raw)
Oxidative stress by tumor-derived macrophages suppresses the expression of CD3 zeta chain of T-cell receptor complex and antigen-specific T-cell responses
M Otsuji et al. Proc Natl Acad Sci U S A. 1996.
Abstract
One of the important mechanisms of immunosuppression in the tumor-bearing status has been attributed to the down-modulation of the CD3 zeta chain and its associated signaling molecules in T cells. Thus, the mechanism of the disappearance of CD3 zeta was investigated in tumor-bearing mice (TBM). The decrease of CD3 zeta was observed both in the cell lysate and intact cells. Direct interaction of T cells with macrophages from TBM (TBM-macrophages) induced the decrease of CD3 zeta, and depletion of macrophages rapidly restored the CD3 zeta expression. We found that treatment of such macrophages with N-acetylcysteine, known as antioxidant compound, prevented the decrease of CD3 zeta. Consistent with this result, the addition of oxidative reagents such as hydrogen peroxide and diamide induced the decrease of CD3 zeta expression in T cells. Consequently, the loss of CD3 zeta resulted in suppression of the antigen-specific T-cell response. These results demonstrate that oxidative stress by macrophages in tumor-bearing status induces abnormality of the T-cell receptor complex by cell interactions with T cells. Therefore, our findings suggest that oxidative stress contributes to the regulation of the expression and function of the T-cell receptor complex.
Figures
Figure 1
Confocal microscope analysis of the CD3ζ expression in normal splenic T cells (A), T-cell-enriched population from TBM spleen (B), and normal T cells cocultured with TBM-MØs (C). Normal T cells were purified through a nylon wool-column (A and_C_) and then cocultured with TBM-MØs (T−B− spleen cells from TBM) at a ratio of 1:1 for 5 min (C). In B, T-cell-enriched population (approximately 50% were T cells) was prepared through a nylon column. All cells were fixed, permeabilized, and stained with anti-CD3ɛ mAb and anti-CD3ζ mAb-biotin followed by FITC-goat anti-hamster Ig antibodies and quantum red-streptavidin, respectively. Stained cells were analyzed by confocal microscopy LSM410. (×375.)
Figure 2
FACS analysis of the decrease of CD3ζ expression induced by TBM-MØs. (A) Two-color analysis of CD3ζ expression in normal splenic T cells in the absence (Upper) or presence (Lower) of TBM-MØs. Cells were fixed, permeabilized, and stained with anti-CD3ζ mAb-biotin followed by PE-streptavidin and anti-Thy1.2 mAb-FITC. The ratio of T cells to TBM-MØs in the coculture was 2:1. NT, normal T cells. (B) Dose-dependent decrease of CD3ζ expression in T cells by TBM-MØs. Normal purified splenic T cells were cocultured for 5 min with the indicated numbers of TBM-MØs (T−B− spleen cells from TBM). The cells were fixed, permeabilized, and stained with anti-CD3ζ mAb-biotin and PE-streptavidin. Stained cells were analyzed by FACScan.
Figure 3
LPS-induced but not thioglycolate-induced peritoneal macrophages have the ability to decrease CD3ζ expression in T cells. Peritoneal macrophages induced by thioglycolate (Thio pMØ) (Upper) or by the combination of thioglycolate and LPS (Thio+LPS pMØ) (Lower) were cocultured with normal purified splenic T cells at a 1:2 ratio. Normal T cells alone (dotted line) and T cells mixed with these macrophages (thin line with shaded histogram) were fixed, permeabilized, and stained with anti-CD3ζ mAb-biotin and PE-streptavidin. The broken line showes a control staining. Stained cells were analyzed by FACScan.
Figure 4
Decrease of CD3ζ in T cells is induced by direct interaction with TBM-MØs and is reversible by depletion of TBM-MØs. (A) Depletion of TBM-MØs recovered the decrease of the CD3ζ expression. The CD3ζ expression was analyzed in normal T cells (dotted line), T cells enriched from TBM spleen (thick line), and TBM splenic T cells that were immediately fixed after depletion of TBM-MØs with anti-HSA and anti-Mac-1 mAbs-coupled magnetic beads (thin line with shaded histogram). The broken line shows a control staining. (B) Fixed T cells kept the decreased level of the CD3ζ expression even after depletion of TBM-MØs. The mixture of TBM-MØs and T cells was fixed first and then TBM-MØs were depleted. These fixed T cells exhibited dye exclusion, indicating that the membrane was not permeabilized by this treatment. The CD3ζ expression was analyzed in normal T cells (dotted line), T cells enriched from TBM spleen (thick line), and TBM splenic T cells after fixation followed by depletion of TBM-MØs (thin line with shaded histogram). The broken line shows a control staining. (C) The decrease of CD3ζ required the close contact between T cells and TBM-MØs. T cells were cocultured with TBM-MØs for 30 min by separation with a pore membrane (thin line with shaded histogram) as compared with normal T cells (dotted line) and the expression of CD3ζ was assessed. The broken line shows a control staining. (D) The decrease of the CD3ζ expression is not mediated by soluble factors from TBM-MØs. T cells were fixed, permeabilized, and then incubated with the supernatant of permeabilized/fixed TBM-MØs (thin line with shaded histogram) as compared with normal T cells (dotted line) and the CD3ζ expression was analyzed. The broken line shows a control staining. The supernatant of the permeabilized TBM-MØs was transferred onto the fixed/permeabilized T cells and incubated for 10 min. While A and B were analyzed by staining with anti-CD3ζ mAb and FITC-goat anti-hamster mAb,C and D were stained with anti-CD3ζ mAb-biotin and PE-streptavidin. All four experiments were performed independently. Stained cells were analyzed by FACScan.
Figure 5
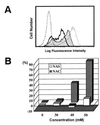
Inhibition of the decrease of CD3ζ expression by NAC but not NAS. (A) The CD3ζ expression in normal T cells (dotted line), T cells cocultured with TBM-MØs (thick line), and T cells cocultured with TBM-MØs pretreated for 30 min with 40 mM NAC (thin line with shaded histogram). The broken line shows a control staining. (B) NAC (shaded bar) but not NAS (open bar) inhibits the decrease of CD3ζ expression in a dose-dependent fashion. TBM-MØs were pretreated with indicated doses of NAC or NAS for 30 min and then cocultured with purified splenic T cells for 5 min T cells were then fixed, permeabilized, and stained with anti-CD3ζ mAb-biotin and PE-streptavidin. Stained cells were analyzed by FACScan. The expression level of CD3ζ was presented as a percentage of the level of normal T cells. The original FACS profile for this graph was represented in A.
Figure 6
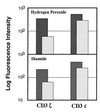
Expression of CD3ζ and CD3ɛ in T cells treated (striped lightly shaded bar) with hydrogen peroxide (Upper) or diamide (Lower) or untreated (darkly shaded bar). Splenic T cells were purified through a nylon column, incubated with 10 mM hydrogen peroxide or 50 mM diamide for 15 min, fixed, permeabilized, and stained with anti-CD3ζ mAb-biotin or anti-CD3ɛ mAb-biotin. Stained cells were analyzed by FACScan and the relative logarithm of fluorescence intensities is presented.
Figure 7
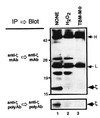
Decrease of CD3ζ in T cells by oxidative stress of hydrogen peroxide or by coculture with TBM-MØs. Splenic T cells (5 × 10⁷ cells) were treated with medium alone (lane 1), 50 mM hydrogen peroxide (lane 2), or cocultured with 5 × 10⁷ TBM-MØs for 15 min. Cell lysates were prepared with Nonidet P-40 lysis buffer containing various protease inhibitors, immunoprecipitated with anti-CD3ζ mAb (Upper) or polyclonal anti-CD3ζ sera (Lower), analyzed by SDS/PAGE on 13% gels under reducing condition, and blotted with anti-CD3ζ mAb (Upper) or polyclonal antisera (Lower), respectively. The analysis of cell lysates prepared with a RIPA buffer was also performed for H2O2-treated T cells and showed the same result (data not shown). The arrows labeled ζ, H, and L indicate the molecular size for CD3ζ, Ig heavy chain, and Ig light chain used for immunoprecipitation, respectively. Molecular masses (kDa) of protein standards are indicated at the left.
Figure 8
Decrease of CD3ζ by TBM-MØs resulted in suppression of antigen-specific T-cell proliferative response. (A) The decrease of CD3ζ expression in splenic T cells by coculture with graded numbers of TBM-MØs. T cell/TBM-MØ ratio was 100:1 (thin line), 10:1 (thick line), and 1:1 (thin line with shaded histogram), respectively. OVA-specific T cells were purified through a nylon column from the spleen of OVA-specific TCR transgenic mice and cocultured with graded numbers of TBM-MØs from normal tumor-bearing mice. After 5 min as well as 2 days incubation, a part of the cells were collected, fixed, permealized, and stained with anti-CD3ζ-biotin and FITC-streptavidin. Stained cells were analyzed by FACScan. The staining profile after a 5-min incubation was shown. The profile after a 2-day incubation was quite similar. (B) Antigen-specific (open squares) and antigen-nonspecific (solid circles) T-cell proliferation of OVA-specific T cells cocultured with TBM-MØs at the ratios indicated in A. Approximately 1 × 10⁵ nylon-column-purified OVA-specific splenic T cells were cultured with 5 × 10⁵ irradiated (3000 rad) T-cell-depleted spleen cells as antigen-presenting cell source and graded numbers of TBM-MØs in the presence of OVA peptide (30 nM) or the combination of PMA (100 ng/ml) and A23187 (5 ng/ml). Proliferation was assessed by [3H]thymidine incorporation in a triplicate culture. The results are the mean ± SD.
Similar articles
- Oxidative stress is involved in the heat stress-induced downregulation of TCR zeta chain expression and TCR/CD3-mediated Ca(2+) response in human T-lymphocytes.
Nambiar MP, Fisher CU, Enyedy EJ, Warke VG, Kumar A, Tsokos GC. Nambiar MP, et al. Cell Immunol. 2002 Feb;215(2):151-61. doi: 10.1016/s0008-8749(02)00006-0. Cell Immunol. 2002. PMID: 12202152 - Activated macrophages induce structural abnormalities of the T cell receptor-CD3 complex.
Aoe T, Okamoto Y, Saito T. Aoe T, et al. J Exp Med. 1995 May 1;181(5):1881-6. doi: 10.1084/jem.181.5.1881. J Exp Med. 1995. PMID: 7722462 Free PMC article. - Do structural changes of T cell receptor complex occur in tumor-bearing state?
Noda S, Nagata-Narumiya T, Kosugi A, Narumiya S, Ra C, Fujiwara H, Hamaoka T. Noda S, et al. Jpn J Cancer Res. 1995 Apr;86(4):383-94. doi: 10.1111/j.1349-7006.1995.tb03068.x. Jpn J Cancer Res. 1995. PMID: 7775260 Free PMC article. - Down-regulation of zeta-chain expression in T cells: a biomarker of prognosis in cancer?
Whiteside TL. Whiteside TL. Cancer Immunol Immunother. 2004 Oct;53(10):865-78. doi: 10.1007/s00262-004-0521-0. Epub 2004 Apr 29. Cancer Immunol Immunother. 2004. PMID: 15118842 Free PMC article. Review. - Signaling defects in T lymphocytes of patients with malignancy.
Whiteside TL. Whiteside TL. Cancer Immunol Immunother. 1999 Oct;48(7):346-52. doi: 10.1007/s002620050585. Cancer Immunol Immunother. 1999. PMID: 10501846 Free PMC article. Review.
Cited by
- Aryl hydrocarbon receptor activation drives polymorphonuclear myeloid-derived suppressor cell response and efficiently attenuates experimental Sjögren's syndrome.
Wei Y, Peng N, Deng C, Zhao F, Tian J, Tang Y, Yu S, Chen Y, Xue Y, Xiao F, Zhou Y, Li X, Zou H, Rui K, Lin X, Lu L. Wei Y, et al. Cell Mol Immunol. 2022 Dec;19(12):1361-1372. doi: 10.1038/s41423-022-00943-5. Epub 2022 Nov 11. Cell Mol Immunol. 2022. PMID: 36369368 Free PMC article. - Immune suppression by neutrophils and granulocytic myeloid-derived suppressor cells: similarities and differences.
Pillay J, Tak T, Kamp VM, Koenderman L. Pillay J, et al. Cell Mol Life Sci. 2013 Oct;70(20):3813-27. doi: 10.1007/s00018-013-1286-4. Epub 2013 Feb 20. Cell Mol Life Sci. 2013. PMID: 23423530 Free PMC article. Review. - Peroxynitrite in the tumor microenvironment changes the profile of antigens allowing escape from cancer immunotherapy.
Tcyganov EN, Sanseviero E, Marvel D, Beer T, Tang HY, Hembach P, Speicher DW, Zhang Q, Donthireddy LR, Mostafa A, Tsyganova S, Pisarev V, Laufer T, Ignatov D, Ferrone S, Meyer C, Maby-El Hajjami H, Speiser DE, Altiok S, Antonia S, Xu X, Xu W, Zheng C, Schuchter LM, Amaravadi RK, Mitchell TC, Karakousis GC, Yuan Z, Montaner LJ, Celis E, Gabrilovich DI. Tcyganov EN, et al. Cancer Cell. 2022 Oct 10;40(10):1173-1189.e6. doi: 10.1016/j.ccell.2022.09.001. Cancer Cell. 2022. PMID: 36220073 Free PMC article. - Targeting of Nrf2 improves antitumoral responses by human NK cells, TIL and CAR T cells during oxidative stress.
Renken S, Nakajima T, Magalhaes I, Mattsson J, Lundqvist A, Arnér ESJ, Kiessling R, Wickström SL. Renken S, et al. J Immunother Cancer. 2022 Jun;10(6):e004458. doi: 10.1136/jitc-2021-004458. J Immunother Cancer. 2022. PMID: 35738800 Free PMC article. - Linking Immunoevasion and Metabolic Reprogramming in B-Cell-Derived Lymphomas.
Böttcher M, Baur R, Stoll A, Mackensen A, Mougiakakos D. Böttcher M, et al. Front Oncol. 2020 Nov 5;10:594782. doi: 10.3389/fonc.2020.594782. eCollection 2020. Front Oncol. 2020. PMID: 33251150 Free PMC article. Review.
References
- Van der Bruggen P, Tranversari C, Chomez P, Lurquin C, De Plaen E, Van der Eynde B, Knuth A, Boon T. Science. 1991;254:1643–1647. - PubMed
- Becker J C, Brabletz T, Czerny C, Termeer C, Brocker E B. Int. Immunol. 1993;5:1501–1508. - PubMed
- Townsend S E, Allison J P. Science. 1993;259:368–370. - PubMed
Publication types
MeSH terms
Substances
LinkOut - more resources
Full Text Sources
Other Literature Sources


