Different response to Plasmodium falciparum malaria in west African sympatric ethnic groups - PubMed (original) (raw)
Comparative Study
Different response to Plasmodium falciparum malaria in west African sympatric ethnic groups
D Modiano et al. Proc Natl Acad Sci U S A. 1996.
Abstract
The comparison of malaria indicators among populations that have different genetic backgrounds and are uniformly exposed to the same parasite strains is one approach to the study of human heterogeneties in the response to the infection. We report the results of comparative surveys on three sympatric West African ethnic groups, Fulani, Mossi, and Rimaibé, living in the same conditions of hyperendemic transmission in a Sudan savanna area northeast of Ouagadougou, Burkina Faso. The Mossi and Rimaibé are Sudanese negroid populations with a long tradition of sedentary farming, while the Fulani are nomadic pastoralists, partly settled and characterized by non-negroid features of possible caucasoid origin. Parasitological, clinical, and immunological investigations showed consistent interethnic differences in Plasmodium falciparum infection rates, malaria morbidity, and prevalence and levels of antibodies to various P. falciparum antigens. The data point to a remarkably similar response to malaria in the Mossi and Rimaibé, while the Fulani are clearly less parasitized, less affected by the disease, and more responsive to all antigens tested. No difference in the use of malaria protective measures was demonstrated that could account for these findings, and sociocultural or environmental factors do not seem to be involved. Known genetic factors of resistance to malaria did not show higher frequencies in the Fulani. The differences in the immune response were not explained by the entomological observations, which indicated substantially uniform exposure to infective bites. The available data support the existence of unknown genetic factors, possibly related to humoral immune responses, determining interethnic differences in the susceptibility to malaria.
Figures
Figure 1
Sketch map of the study area showing the villages of Barkoumbilen and Barkoundouba. Capital letters indicate the position of the compounds of the ethnic groups. M, Mossi; R, Rimaibé; F, Fulani.
Figure 2
Entomological inoculation rates in the compounds of the three ethnic groups (Mossi, Rimaibé, and Fulani) in the Barkoundouba area from August 1994 to October 1995.
Figure 3
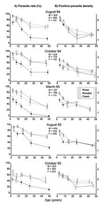
Values ± standard errors, by age and ethnic group, of P. falciparum parasite rate (A) and log10 of positive parasite density (B) in the Barkoundouba area, Burkina Faso. The positions of the symbols on the_x_-axis correspond to the mean age for each of the following age groups: 0–5, 6–10, 11–20, 21–30, and >30 years. Data refer to five cross-sectional surveys (August 1994, October 1994, March 1995, August 1995, and October 1995). To indicate a significant difference between the Fulani and one or both the other two groups, we used a half-filled or filled symbols, respectively. The sample sizes of each survey are shown under the respective month. M, Mossi; R, Rimaibé; and F, Fulani.
Figure 4
Comparative analysis in three sympatric ethnic groups of the percentage (± SE) of negative individuals at the first examination (August 1994) and rate of persistence of their negativity in the successive cross-sectional surveys. Only individuals more than 10 years old and examined in all five surveys of Fig. 1 are considered. No significant difference of mean age was observed among the three subsamples. The comparison does not include the 0–10 year age groups, since their negativity rates were too low for this type of analysis. All the Fulani/Mossi and Fulani/Rimaibé comparisons are statistically significant with P < 0.01.
Figure 5
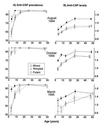
Anti-P. falciparum CSP antibody prevalences (A) and levels (B) by age and ethnic group. The data refer to the same samples examined in the first three surveys illustrated in Fig. 3 and the same symbols are used. The prevalences are shown as percent positive ± SE, and the levels are shown as log10 immunoenzymatic units ± SE.
Similar articles
- Humoral response to Plasmodium falciparum Pf155/ring-infected erythrocyte surface antigen and Pf332 in three sympatric ethnic groups of Burkina Faso.
Modiano D, Chiucchiuini A, Petrarca V, Sirima BS, Luoni G, Perlmann H, Esposito F, Coluzzi M. Modiano D, et al. Am J Trop Med Hyg. 1998 Feb;58(2):220-4. doi: 10.4269/ajtmh.1998.58.220. Am J Trop Med Hyg. 1998. PMID: 9502607 - Interethnic differences in the humoral response to non-repetitive regions of the Plasmodium falciparum circumsporozoite protein.
Modiano D, Chiucchiuini A, Petrarca V, Sirima BS, Luoni G, Roggero MA, Corradin G, Coluzzi M, Esposito F. Modiano D, et al. Am J Trop Med Hyg. 1999 Oct;61(4):663-7. doi: 10.4269/ajtmh.1999.61.663. Am J Trop Med Hyg. 1999. PMID: 10548307 - Plasmodium falciparum malaria in sympatric ethnic groups of Burkina Faso, west Africa.
Modiano D, Petrarca V, Sirima BS, Bosman A, Nebié I, Diallo D, Lamizana L, Esposito F, Coluzzi M. Modiano D, et al. Parassitologia. 1995 Dec;37(2-3):255-9. Parassitologia. 1995. PMID: 8778668 - The lower susceptibility to Plasmodium falciparum malaria of Fulani of Burkina Faso (west Africa) is associated with low frequencies of classic malaria-resistance genes.
Modiano D, Luoni G, Sirima BS, Lanfrancotti A, Petrarca V, Cruciani F, Simporé J, Ciminelli BM, Foglietta E, Grisanti P, Bianco I, Modiano G, Coluzzi M. Modiano D, et al. Trans R Soc Trop Med Hyg. 2001 Mar-Apr;95(2):149-52. doi: 10.1016/s0035-9203(01)90141-5. Trans R Soc Trop Med Hyg. 2001. PMID: 11355545 - Different response to Plasmodium falciparum in west African sympatric ethnic groups: possible implications for malaria control strategies.
Modiano D, Petrarca V, Sirima BS, Luoni G, Nebie I, Diallo DA, Esposito F, Coluzzi M. Modiano D, et al. Parassitologia. 1999 Sep;41(1-3):193-7. Parassitologia. 1999. PMID: 10697855 Review.
Cited by
- Functional analysis of a promoter variant of the gene encoding the interferon-gamma receptor chain I.
Jüliger S, Bongartz M, Luty AJ, Kremsner PG, Kun JF. Jüliger S, et al. Immunogenetics. 2003 Jan;54(10):675-80. doi: 10.1007/s00251-002-0516-y. Epub 2002 Dec 14. Immunogenetics. 2003. PMID: 12557053 - Differential antibody response to the Anopheles gambiae gSG6 and cE5 salivary proteins in individuals naturally exposed to bites of malaria vectors.
Rizzo C, Lombardo F, Ronca R, Mangano V, Sirima SB, Nèbiè I, Fiorentino G, Modiano D, Arcà B. Rizzo C, et al. Parasit Vectors. 2014 Nov 28;7:549. doi: 10.1186/s13071-014-0549-8. Parasit Vectors. 2014. PMID: 25428638 Free PMC article. - Distribution of FcγR gene polymorphisms among two sympatric populations in Mali: differing allele frequencies, associations with malariometric indices and implications for genetic susceptibility to malaria.
Cherif M, Amoako-Sakyi D, Dolo A, Pearson JO, Gyan B, Obiri-Yeboah D, Nebie I, Sirima SB, Doumbo O, Troye-Blomberg M, Bakary M. Cherif M, et al. Malar J. 2016 Jan 19;15:29. doi: 10.1186/s12936-015-1082-8. Malar J. 2016. PMID: 26785902 Free PMC article. - A Malaria-Resistant Phenotype with Immunological Correlates in a Tanzanian Birth Cohort Exposed to Intense Malaria Transmission.
Nash SD, Prevots DR, Kabyemela E, Khasa YP, Lee KL, Fried M, Duffy PE. Nash SD, et al. Am J Trop Med Hyg. 2017 May;96(5):1190-1196. doi: 10.4269/ajtmh.16-0554. Am J Trop Med Hyg. 2017. PMID: 28500801 Free PMC article. - Randomized non-inferiority and safety trial of dihydroartemisin-piperaquine and artesunate-amodiaquine versus artemether-lumefantrine in the treatment of uncomplicated Plasmodium falciparum malaria in Cameroonian children.
Nji AM, Ali IM, Moyeh MN, Ngongang EO, Ekollo AM, Chedjou JP, Ndikum VN, Evehe MS, Froeschl G, Heumann C, Mansmann U, Ogundahunsi O, Mbacham WF. Nji AM, et al. Malar J. 2015 Jan 28;14:27. doi: 10.1186/s12936-014-0521-2. Malar J. 2015. PMID: 25626448 Free PMC article. Clinical Trial.
References
- Miller L H. In: Malaria: Principles and Practice of Malariology. Wernsdorfer W H, McGregor I Sir, editors. Edinburgh: Churchill Livingstone; 1988. pp. 488–500.
- Hill A V S, Allsopp C E M, Kwiatkowski D, Anstey N M, Twumasi P, Rowe P A, Bennett S, Brewster D, McMichael A J, Greenwood B M. Nature (London) 1991;352:595–600. - PubMed
- Aidoo M, Lalvani A, Allsopp C E M. Lancet. 1995;345:1003–1006. - PubMed
- Piazza A, Belvedere M C, Bernoco D, Conighi C, Contu L, Curton E S, Mattiuz P L, Mayr W, Richiardi P, Scudeller G, Ceppellini R. In: Histocompatibility Testing: 1972. Dausset J, Colombani J, editors. Baltimore: Williams & Wilkins; 1973. pp. 73–84.
- Armstrong J C. Trans R Soc Trop Med Hyg. 1978;72:342–344. - PubMed
Publication types
MeSH terms
Substances
LinkOut - more resources
Full Text Sources


