Oscillatory gamma-band (30-70 Hz) activity induced by a visual search task in humans - PubMed (original) (raw)
Oscillatory gamma-band (30-70 Hz) activity induced by a visual search task in humans
C Tallon-Baudry et al. J Neurosci. 1997.
Abstract
The coherent representation of an object in the visual system has been suggested to be achieved by the synchronization in the gamma-band (30-70 Hz) of a distributed neuronal assembly. Here we measure variations of high-frequency activity on the human scalp. The experiment is designed to allow the comparison of two different perceptions of the same picture. In the first condition, an apparently meaningless picture that contained a hidden Dalmatian, a neutral stimulus, and a target stimulus (twirled blobs) are presented. After the subject has been trained to perceive the hidden dog and its mirror image, the second part of the recordings is performed (condition 2). The same neutral stimulus is presented, intermixed with the picture of the dog and its mirror image (target stimulus). Early (95 msec) phase-locked (or stimulus-locked) gamma-band oscillations do not vary with stimulus type but can be subdivided into an anterior component (38 Hz) and a posterior component (35 Hz). Nonphase-locked gamma-band oscillations appear with a latency jitter around 280 msec after stimulus onset and disappear in averaged data. They increase in amplitude in response to both target stimuli. They also globally increase in the second condition compared with the first one. It is suggested that this gamma-band energy increase reflects both bottom-up (binding of elementary features) and top-down (search for the hidden dog) activation of the same neural assembly coding for the Dalmatian. The relationships between high- and low-frequency components of the response are discussed, and a possible functional role of each component is suggested.
Figures
Fig. 1.
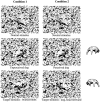
The six stimuli used. In the first condition (left column), subjects were presented three types of stimuli: a neutral stimulus (meaningless blobs), an unperceived dog (Dalmatian, with its head to the right and tail to the left, unperceived as a dog because subjects were not instructed of its presence), and a target stimulus, made of meaningless twirled blobs. Before the beginning of the second recording session (Condition 2, right column), subjects were trained to perceive the Dalmatian with its head turned either to the right or to the left (the hidden outlines of the dogs are given on the_right_). In both conditions, the task of the subjects was to silently count the occurrences of the target stimulus.
Fig. 2.
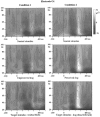
Time–frequency representation of the energy averaged across single trials, grand averaged across subjects at electrode O1. Time is presented on the _x_-axis, stimulus onset being indicated by the vertical bar at 0 msec. Frequency between 20 and 100 Hz is presented on the_y_-axis. Energy values are coded on a gray scale, the highest energy values appearing white. Data are baseline-subtracted, thus providing positive and negative energy values. A decrease of energy compared with baseline level can be observed in response to all stimuli around 190 msec, followed by an increase of TF energy around 280 msec and 35 Hz. This increase is much more pronounced in Condition 2. It can be observed at all electrodes but tends to be stronger at posterior locations.
Fig. 3.
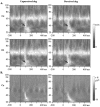
A, Phase-locking factor (grand average across subjects) at electrodes Cz (anterior) and_O1_ (posterior) in response to the unperceived and perceived dogs. An early phase-locked component peaks at 95 msec (arrows). There do not seem to be any differences between stimulus types, but a variation in peak frequency with electrode location can be observed; the frequency of this first peak is higher at anterior sites. The continuous line at 62 Hz corresponds to the frame rate of our video monitor, which is phase-locked to the stimulus onset. B, TF energy of the averaged evoked potential (grand average across subjects) at electrode_Cz_, in response to the unperceived and perceived dogs. Only the 95 msec, phase-locked peak of TF energy can be observed; both the decrease at 190 msec and the increase at 280 msec of TF energy averaged across single trials observed in Figure 2 disappear completely; these components are thus non-phase-locked to stimulus onset.
Fig. 4.
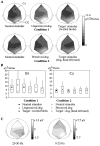
A, Topographic maps of the TF energy of the averaged evoked potential, averaged between 70 and 120 msec, 25 and 50 Hz (grand averaged across subjects). The montage is shown as viewed from 45° from behind the vertex of the head of the subject (electrodes Cz and O2 are indicated on top of the figure). Local maxima can be found at two different sites: one anterior (Cz, C4) and another posterior (O1, O2). B, Mean (symbol), median (horizontal line), and 75th and 25th percentiles (box) of the mean TF energy of the averaged evoked potential (70–120 msec, 25–50 Hz). The vertical line extends from the 10th percentile to the 90th percentile. This illustrates the high intersubject variability, as well as the non-Gaussian distribution of the data. No significant difference between stimulus types can be found. C, Topographic maps at 90 msec of the averaged evoked potential of one subject, 25–50 Hz filtered (left) and 0–25 Hz filtered (right). The topographies of the high- and low-frequency components of the averaged evoked potential are clearly distinct. Note the smaller amplitude of the 25–50 Hz filtered evoked potential compared with the 0–25 Hz filtered signal.
Fig. 5.
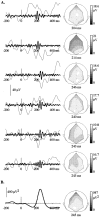
A, Single trials at electrode POz, in response to the perceived dog, 0–25 Hz filtered, 12 dB per octave (thin line) and 25–45 Hz filtered, 24 and 48 dB per octave (thick lines), and topographic maps of the maximal positive peak of the 25–45 Hz filtered potential (latency indicated below each map). Within trials, this topography is stable over several cycles. The amplitude of the γ-band oscillations can reach 20 μV. The duration of the oscillatory events is usually comprised between 100 and 150 msec, and their jitter in time can reach 40 msec. The topography of the maximal positive peak is widespread, with a rather posterior maximum. B, Time course and peak topography of the mean 25–45 Hz energy averaged across single trials (same subject as in A). The highest energy is reached at electrodes O1 and POz.
Fig. 6.
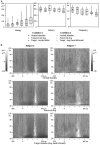
A, Mean (symbol), median (horizontal line), and 75th and 25th percentiles (box) of the maximal values of the second high-frequency peak measured on the TF energy averaged across single trials. The vertical line_extends from the 10th to the 90th percentile. Note the high intersubject variability and the non-Gaussian distribution of the energy. Two effects can be observed: (1) the energy of the second peak is higher in Condition 2 than in Condition 1, and its frequency is lower; and (2) its energy is higher and its frequency lower in response to target stimuli than in response to nontarget stimuli. No significant differences can be found on the latency. B, TF representation of the energy averaged across single trials of two subjects at electrode Pz, in the second condition. Subject 3 (left) shows an increase for both the perceived and the target dogs, whereas_Subject 7 (right) shows an increase only in response to the target dog.
Fig. 7.
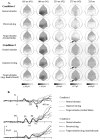
A, Topographic maps of the 0–25 Hz filtered averaged evoked potentials, grand average across subjects. There are no topographical differences between stimulus type at the latencies of the first three major peaks (P1, N1, and_P2_). At longer latencies, potentials tend to be less positive in the second condition than in the first (shaded box at 275 and 325 msec). At 275 msec, an increased occipital negativity (N2, indicated by arrows) appears in response to both target stimuli and in response to the perceived dog. B, 0–25 Hz filtered average evoked potentials, grand average across subjects, at electrodes_Iz_, P4, and C4. The_arrow_ indicates the enhancement of the N2_in response to the target stimuli and the perceived dog. Gray areas underline the overall difference between_Conditions 1 and 2.
Fig. 8.
Summary of results. High-frequency components are described on top of the figure, low-frequency components on the bottom. Latencies at which significant effects occur are shaded. See the end of Results for details.
Similar articles
- Stimulus specificity of phase-locked and non-phase-locked 40 Hz visual responses in human.
Tallon-Baudry C, Bertrand O, Delpuech C, Pernier J. Tallon-Baudry C, et al. J Neurosci. 1996 Jul 1;16(13):4240-9. doi: 10.1523/JNEUROSCI.16-13-04240.1996. J Neurosci. 1996. PMID: 8753885 Free PMC article. - Time dynamics of stimulus- and event-related gamma band activity: contrast-VEPs and the visual P300 in man.
Sannita WG, Bandini F, Beelke M, De Carli F, Carozzo S, Gesino D, Mazzella L, Ogliastro C, Narici L. Sannita WG, et al. Clin Neurophysiol. 2001 Dec;112(12):2241-9. doi: 10.1016/s1388-2457(01)00700-3. Clin Neurophysiol. 2001. PMID: 11738194 - EEG early evoked gamma-band synchronization reflects object recognition in visual oddball tasks.
Stefanics G, Jakab A, Bernáth L, Kellényi L, Hernádi I. Stefanics G, et al. Brain Topogr. 2004 Summer;16(4):261-4. doi: 10.1023/b:brat.0000032862.38122.b6. Brain Topogr. 2004. PMID: 15379224 - High frequency oscillations as a correlate of visual perception.
Martinovic J, Busch NA. Martinovic J, et al. Int J Psychophysiol. 2011 Jan;79(1):32-8. doi: 10.1016/j.ijpsycho.2010.07.004. Epub 2010 Jul 21. Int J Psychophysiol. 2011. PMID: 20654659 Review. - [High freuquency oscillatory activity in the human brain].
Müller MM. Müller MM. Z Exp Psychol. 2000;47(4):231-52. Z Exp Psychol. 2000. PMID: 11132401 Review. German.
Cited by
- Frontotemporal lobar degeneration changes neuronal beta-frequency dynamics during the mismatch negativity response.
Perry A, Hughes LE, Adams NE, Naessens M, Kloosterman NA, Rouse MA, Murley AG, Street D, Jones PS, Rowe JB. Perry A, et al. Neuroimage Clin. 2024 Sep 10;44:103671. doi: 10.1016/j.nicl.2024.103671. Online ahead of print. Neuroimage Clin. 2024. PMID: 39305652 Free PMC article. - Transcranial focused ultrasound to V5 enhances human visual motion brain-computer interface by modulating feature-based attention.
Kosnoff J, Yu K, Liu C, He B. Kosnoff J, et al. Nat Commun. 2024 Jun 11;15(1):4382. doi: 10.1038/s41467-024-48576-8. Nat Commun. 2024. PMID: 38862476 Free PMC article. - Neuromodulation of inhibitory control using phase-lagged transcranial alternating current stimulation.
Kim Y, Lee JH, Park JC, Kwon J, Kim H, Seo J, Min BK. Kim Y, et al. J Neuroeng Rehabil. 2024 May 30;21(1):93. doi: 10.1186/s12984-024-01385-y. J Neuroeng Rehabil. 2024. PMID: 38816860 Free PMC article. - A distributed theta network of error generation and processing in aging.
Kolev V, Falkenstein M, Yordanova J. Kolev V, et al. Cogn Neurodyn. 2024 Apr;18(2):447-459. doi: 10.1007/s11571-023-10018-4. Epub 2023 Nov 16. Cogn Neurodyn. 2024. PMID: 38699606 - Motor oscillations reveal new correlates of error processing in the human brain.
Yordanova J, Falkenstein M, Kolev V. Yordanova J, et al. Sci Rep. 2024 Mar 7;14(1):5624. doi: 10.1038/s41598-024-56223-x. Sci Rep. 2024. PMID: 38454108 Free PMC article.
References
- Begleiter H, Porjesz B, Wang W. A neurophysiologic correlate of visual short-term memory in humans. Electroencephalogr Clin Neurophysiol. 1993;87:46–53. - PubMed
- Bertrand O, Pantev C. Stimulus frequency dependence of the transient oscillatory auditory evoked responses (40 Hz) studied by electric and magnetic recordings in human. In: Pantev C, Elbert T, Lütkenhöner B, editors. Oscillatory event-related brain dynamics. Plenum; New York: 1994. pp. 231–242.
- Bertrand O, Tallon-Baudry C, Pernier J. Time frequency analysis of oscillatory γ-band activity: wavelet approach and phase-locking estimation. Biomag96: advances in biomagnetism research Wood CC, et al. 1996. Springer; New York: in press.
- Brosch M, Bauer R, Eckhorn R. Synchronous high-frequency oscillations in cat area 18. Eur J Neurosci. 1995;7:86–95. - PubMed
Publication types
MeSH terms
LinkOut - more resources
Full Text Sources
Other Literature Sources
