The autophagic and endocytic pathways converge at the nascent autophagic vacuoles - PubMed (original) (raw)
The autophagic and endocytic pathways converge at the nascent autophagic vacuoles
W Liou et al. J Cell Biol. 1997.
Abstract
We used an improved cryosectioning technique in combination with immunogold cytochemistry and morphometric analysis to study the convergence of the autophagic and endocytic pathways in isolated rat hepatocytes. The endocytic pathway was traced by continuous uptake of gold tracer for various time periods, up to 45 min, while the cells were incubated in serum-free medium to induce autophagy. Endocytic structures involved in fusion with autophagic vacuoles (AV) were categorized into multivesicular endosomes (MVE) and vesicular endosomes (VE). Three types of AV--initial (AVi), intermediate (AVi/d), and degradative (AVd)--were defined by morphological criteria and immunogold labeling characteristics of marker enzymes. The entry of tracer into AV, manifested as either tracer-containing AV profiles (AV+) or fusion profiles (FP+) between AV and tracer-positive endosomal vesicles/vacuoles, was detected as early as 10 min after endocytosis. The number of AV+ exhibited an exponential increase with time. FP+ between MVE or VE and all three types of AV were observed. Among the 112 FP+ scored, 36% involved VE. Of the AV types, AVi and AVi/d were found five to six times more likely to be involved in fusions than AVd. These fusion patterns did not significantly change during the period of endocytosis (15-45 min). We conclude that the autophagic and endocytic pathways converge in a multistage fashion starting within 10 min of endocytosis. The nascent AV is the most upstream and preferred fusion partner for endosomes.
Figures
Figure 3
Appearance of tracer in AV. Cells were allowed to endocytose tracer particles continuously for the designated periods of time. At each time, random sections were searched for AV+, and AV+/500 cell profiles were plotted. The number of cell profiles examined (denominator) and the respective number of AV+ scored (numerator) are listed above the graph.
Figure 7
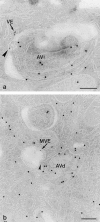
ASGP-R labeling in FP+ and endosomes. Cells exposed for 40 min to 5-nm gold tracer. Section immunolabeled for ASGP-R with 10-nm gold. (a) Low ASGP-R labeling in tracer-carrying endocytic vesicles (arrowheads), adjacent to (top) or fusing with (bottom) an AVi/d. (b) ASGP-R labeling at the plasma membrane and in endosomal elements near the cell surface (ex, extra cellular space). Vesicles of the MVE (asterisk) and VE (arrowhead) type, containing endocytosed gold, are present in the same area. (c) As b. A VE-like vesicle with endocytosed gold and low ASGP-R labeling (arrowhead) is shown connected to an ASGP–R rich element (arrow), possibly a recycling endosome. Bars, 200 nm.
Figure 4
Tracer distribution in AV+ types. Cells were allowed to endocytose tracer particles continuously for the designated periods of time. At each time, random sections were searched for AV+. The results are categorized according to AV types and plotted for the relative distribution of tracers. The total tracer counts are given on top of each bar. The number in each block represents the actual number of AV profiles, from which tracer counts are scored.
Figure 6
Endosome types involved in FP+. The FP+ were classified according to MVE and VE involved. The actual numbers of FP+ analyzed are given above the bars.
Figure 1
Comparison of structural preservation in cryosections picked up with sucrose (a) and MU (b). In isolated hepatocytes, autophagy was induced for 30 min in suspension buffer before fixation. (a) Cryosection picked up with 2.3 M sucrose and labeled for SOD. Note the presence of large, “empty” gaps between sequestered contents of the AV and the surrounding cytoplasm. (b) A similar section as a, but picked up with an MU mixture. The AV are no longer distorted and the overall membranous structures are sharply delineated. The SOD-labeling density of AVi is as that of the cytosol, whereas AVd show much more intense labeling. (Inset) An AVi/d that is distinct from AVi by its single limiting membrane. The highly pleiomorphic AVd are also bound by a distinctive single membrane, but in contrast to AVi/d, their contents are characterized by debris of digested material. Bars, 250 nm.
Figure 2
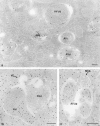
Labeling patterns of cathepsin D and CAIII in MU picked-up cryosections. (a) Cells treated as in Fig. 1_b_, but the section was immunolabeled for cathepsin D, which is not detectable in the AVi, moderately present in the AVi/d, and abundant in AVd. Cells in b and c had endocytosed 5-nm gold tracer for 20 and 40 min, respectively, before fixation and CAIII labeling. (b) Complex fusion profile of a CAIII-positive AVi, an AVd which is without CAIII labeling, and a VE that contains an endocytosed gold probe (arrow). Close to the AVd is another tracer-bearing VE. (c) Fusion profile of a tracer-bearing MVE and an AVi/d that exhibits a single limiting membrane and a CAIII-labeling concentration similar to that of the cytoplasm. Bars, 200 nm.
Figure 5
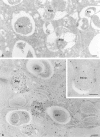
Fusion profiles. Cells exposed to 5-nm gold tracers for 20 (a and c) and 25 min (b) before fixation. Sections were picked up by MU and air-dried (c) or underwent immunolabeling with anti-SOD antibodies (a and b). (a) Fusion between a small VE (arrow) and an AVi. A cluster of two gold particles (arrowhead) is also seen at another location. (b) Fusion between an electron lucent MVE (arrow) and an AVd. (c) Fusion between an MVE (arrow) and an AVd. Bars, 200 nm.
Figure 8
AV types involved in FP+. The same FP+ data as used in Fig. 6 were classified according to the AV types.
Similar articles
- The differential degradation of two cytosolic proteins as a tool to monitor autophagy in hepatocytes by immunocytochemistry.
Rabouille C, Strous GJ, Crapo JD, Geuze HJ, Slot JW. Rabouille C, et al. J Cell Biol. 1993 Feb;120(4):897-908. doi: 10.1083/jcb.120.4.897. J Cell Biol. 1993. PMID: 8432730 Free PMC article. - Ultrastructural and immunocytochemical characterization of autophagic vacuoles in isolated hepatocytes: effects of vinblastine and asparagine on vacuole distributions.
Fengsrud M, Roos N, Berg T, Liou W, Slot JW, Seglen PO. Fengsrud M, et al. Exp Cell Res. 1995 Dec;221(2):504-19. doi: 10.1006/excr.1995.1402. Exp Cell Res. 1995. PMID: 7493651 - In exocrine pancreas, the basolateral endocytic pathway converges with the autophagic pathway immediately after the early endosome.
Tooze J, Hollinshead M, Ludwig T, Howell K, Hoflack B, Kern H. Tooze J, et al. J Cell Biol. 1990 Aug;111(2):329-45. doi: 10.1083/jcb.111.2.329. J Cell Biol. 1990. PMID: 2166050 Free PMC article. - Annexin A6 in the liver: From the endocytic compartment to cellular physiology.
Enrich C, Rentero C, Grewal T. Enrich C, et al. Biochim Biophys Acta Mol Cell Res. 2017 Jun;1864(6):933-946. doi: 10.1016/j.bbamcr.2016.10.017. Epub 2016 Oct 27. Biochim Biophys Acta Mol Cell Res. 2017. PMID: 27984093 Review. - Autophagy in the eukaryotic cell.
Reggiori F, Klionsky DJ. Reggiori F, et al. Eukaryot Cell. 2002 Feb;1(1):11-21. doi: 10.1128/EC.01.1.11-21.2002. Eukaryot Cell. 2002. PMID: 12455967 Free PMC article. Review. No abstract available.
Cited by
- Tubulin polymerization-promoting protein (TPPP/p25α) promotes unconventional secretion of α-synuclein through exophagy by impairing autophagosome-lysosome fusion.
Ejlerskov P, Rasmussen I, Nielsen TT, Bergström AL, Tohyama Y, Jensen PH, Vilhardt F. Ejlerskov P, et al. J Biol Chem. 2013 Jun 14;288(24):17313-35. doi: 10.1074/jbc.M112.401174. Epub 2013 Apr 29. J Biol Chem. 2013. PMID: 23629650 Free PMC article. - Autophagy in innate and adaptive immunity against intracellular pathogens.
Schmid D, Dengjel J, Schoor O, Stevanovic S, Münz C. Schmid D, et al. J Mol Med (Berl). 2006 Mar;84(3):194-202. doi: 10.1007/s00109-005-0014-4. Epub 2006 Jan 28. J Mol Med (Berl). 2006. PMID: 16501849 Review. - Intracellular trafficking of Brucella abortus in J774 macrophages.
Arenas GN, Staskevich AS, Aballay A, Mayorga LS. Arenas GN, et al. Infect Immun. 2000 Jul;68(7):4255-63. doi: 10.1128/IAI.68.7.4255-4263.2000. Infect Immun. 2000. PMID: 10858243 Free PMC article. - The known unknowns of antigen processing and presentation.
Vyas JM, Van der Veen AG, Ploegh HL. Vyas JM, et al. Nat Rev Immunol. 2008 Aug;8(8):607-18. doi: 10.1038/nri2368. Nat Rev Immunol. 2008. PMID: 18641646 Free PMC article. Review. - Brucella abortus transits through the autophagic pathway and replicates in the endoplasmic reticulum of nonprofessional phagocytes.
Pizarro-Cerdá J, Méresse S, Parton RG, van der Goot G, Sola-Landa A, Lopez-Goñi I, Moreno E, Gorvel JP. Pizarro-Cerdá J, et al. Infect Immun. 1998 Dec;66(12):5711-24. doi: 10.1128/IAI.66.12.5711-5724.1998. Infect Immun. 1998. PMID: 9826346 Free PMC article.
References
- Dunn WA., Jr Autophagy and related mechanisms of lysosome-mediated protein degradation. Trends Cell Biol. 1994;4:139–143. - PubMed
- Fengsrud M, Ross N, Berg T, Liou W, Slot JW, Seglen PO. Ultrastructural and immunocytochemical characterization of autophagic vacuoles in isolated hepatocytes: effects of vinblastine and asparagine on vacuole distributions. Exp Cell Res. 1995;221:504–519. - PubMed


