The folding pathway of a protein at high resolution from microseconds to seconds - PubMed (original) (raw)
The folding pathway of a protein at high resolution from microseconds to seconds
B Nölting et al. Proc Natl Acad Sci U S A. 1997.
Abstract
We have documented the folding pathway of the 10-kDa protein barstar from the first few microseconds at the resolution of individual residues from its well characterized denatured state. The denatured state had been shown from NMR to have flickering native-like structure in the first two of its four alpha-helices. phi-value analysis shows that the first helix becomes substantially consolidated as the intermediate is formed in a few hundred microseconds, as does the second to a lesser extent. A native-like structure then is formed in a few hundred milliseconds as the whole structure consolidates. Peptide fragments corresponding to sequences containing the first two helices separately and together as a helix-loop-helix motif have little helical structure under conditions that favor folding. The early stages of folding fit the nucleation-condensation model that was proposed for the smaller chymotrypsin inhibitor 2, which is a single module of structure and folds by two-state kinetics. The early stages of the multistate folding of the larger, multimodular, barnase have proved experimentally inaccessible. The folding pathway of barstar links those of CI2 and barnase to give a unified scheme for folding.
Figures
Figure 1
Structure of barstar, indicating the residues mutated in this study [drawn with the program
molscript
(25)].
Figure 2
T-jump traces for the folding of pseudo-wild-type (P27A/C40A/C82A) barstar in 0 M urea/0.1 M KCl/50 mM Tris·HCl at pH 8 and 10°C under different instrument settings and concentrations. Thirty-six traces were accumulated, each with 500-ns step width, corresponding to 6000 points per trace and a time constant of 1 μs for the measurement with 50 μM protein. Noise was reduced by digital smoothing using a moving window of 30 data points. For the measurement with 6 μM protein, 42 traces were accumulated with a time constant of 5 μs. A 5 times higher light intensity relative to the measurement with 50 μM protein was used. The rate constant did not deviate by more than 5% of 3100 s−1 (= _k_1 + _k_−1) over the concentration range 6 to 50 μM protein and a wide range of instrument settings and heating times. There is no evidence for a lag phase preceding the formation of Itrans.
Figure 3
Amplitude of the CD signal at 222 nm on the folding of barstar at 15°C in a stopped-flow spectrometer. The burst of signal in the dead time relative to the baseline corresponds to the ellipticity of Itrans. The total amplitude of the signal on folding corresponds to that of Ntrans.
Figure 4
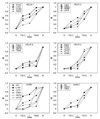
Φ-value analysis. The Φ values for the transition state for the formation of Itrans [TS(1)] are calculated from _k_1 and those for the equilibrium constant for the formation Itrans are calculated from _k_1/_k_−1 with a precision of better than ± 0.1. The Φ values for the transition state for the formation of Ntrans are calculated from the measured values of _k_−2 [from a folding–unfolding double-jump experiment (26)] and are accurate to ±0.15.
Figure 5
General nucleation–condensation model.
Similar articles
- Exploring the folding funnel of a polypeptide chain by biophysical studies on protein fragments.
Neira JL, Fersht AR. Neira JL, et al. J Mol Biol. 1999 Jan 22;285(3):1309-33. doi: 10.1006/jmbi.1998.2249. J Mol Biol. 1999. PMID: 9887278 - Pathway of protein folding.
Fersht AR, Matouschek A, Sancho J, Serrano L, Vuilleumier S. Fersht AR, et al. Faraday Discuss. 1992;(93):183-93. doi: 10.1039/fd9929300183. Faraday Discuss. 1992. PMID: 1290932 Review. - Association of complementary fragments and the elucidation of protein folding pathways.
de Prat-Gay G. de Prat-Gay G. Protein Eng. 1996 Oct;9(10):843-7. doi: 10.1093/protein/9.10.843. Protein Eng. 1996. PMID: 8931123 Review.
Cited by
- Structure-Based Prediction of Protein-Folding Transition Paths.
Jacobs WM, Shakhnovich EI. Jacobs WM, et al. Biophys J. 2016 Sep 6;111(5):925-36. doi: 10.1016/j.bpj.2016.06.031. Biophys J. 2016. PMID: 27602721 Free PMC article. - Optimization of binding electrostatics: charge complementarity in the barnase-barstar protein complex.
Lee LP, Tidor B. Lee LP, et al. Protein Sci. 2001 Feb;10(2):362-77. doi: 10.1110/ps.40001. Protein Sci. 2001. PMID: 11266622 Free PMC article. - Folding of barstar C40A/C82A/P27A and catalysis of the peptidyl-prolyl cis/trans isomerization by human cytosolic cyclophilin (Cyp18).
Golbik R, Fischer G, Fersht AR. Golbik R, et al. Protein Sci. 1999 Jul;8(7):1505-14. doi: 10.1110/ps.8.7.1505. Protein Sci. 1999. PMID: 10422840 Free PMC article. - A folding pathway for betapep-4 peptide 33mer: from unfolded monomers and beta-sheet sandwich dimers to well-structured tetramers.
Mayo KH, Ilyina E. Mayo KH, et al. Protein Sci. 1998 Feb;7(2):358-68. doi: 10.1002/pro.5560070216. Protein Sci. 1998. PMID: 9521112 Free PMC article. - Real-time NMR studies on a transient folding intermediate of barstar.
Killick TR, Freund SM, Fersht AR. Killick TR, et al. Protein Sci. 1999 Jun;8(6):1286-91. doi: 10.1110/ps.8.6.1286. Protein Sci. 1999. PMID: 10386878 Free PMC article.
References
- Wolynes P G, Lutheyschulten Z, Onuchic J N. Chem Biol. 1996;3:425–432. - PubMed
- Eaton W A, Thompson P A, Chan C K, Hagen S J, Hofrichter J. Structure (London) 1996;4:1133–1139. - PubMed
- Pascher T, Chesick J P, Winkler J R, Gray H B. Science. 1996;271:1558–1560. - PubMed
Publication types
MeSH terms
Substances
LinkOut - more resources
Full Text Sources


