Relative numbers of cortical and brainstem inputs to the lateral geniculate nucleus - PubMed (original) (raw)
Relative numbers of cortical and brainstem inputs to the lateral geniculate nucleus
A Erişir et al. Proc Natl Acad Sci U S A. 1997.
Abstract
Terminals of a morphological type known as RD (for round vesicles and dense mitochondria, which we define here as the aggregate of types formerly known as RSD and RLD, where "S" is small and "L" is large) constitute at least half of the synaptic inputs to the feline lateral geniculate nucleus, which represents the thalamic relay of retinal input to cortex. It had been thought that the vast majority of these RD terminals were of cortical origin, making the corticogeniculate pathway by far the largest source of input to geniculate relay cells. However, another source of RD terminals recently identified derives from cholinergic cells of the brainstem parabrachial region. (These cells also contain NO.) We used techniques of electron microscopy to determine quantitatively the relative contribution of cortex and brainstem to the population of RD terminals. We identified corticogeniculate terminals by orthograde transport of biocytin injected into the visual cortex and identified brainstem terminals by immunocytochemical labeling for choline acetyltransferase or brain NO synthase (the synthesizing enzymes for acetylcholine and NO, respectively). We estimated the relative numbers of corticogeniculate and brainstem terminals with a two-step algorithm: First, we determined the relative probability of sampling each terminal type in our material, and then we calculated what mixture of identified corticogeniculate and brainstem terminals was needed to recreate the size distribution of the parent RD terminal population. We conclude that brainstem terminals comprise roughly one-half of the RD population. Thus, the cortical input is perhaps half as large and the brainstem input is an order of magnitude larger than had been thought. This further suggests that the brainstem inputs might play a surprisingly complex and subtle role in the control of the geniculocortical relay.
Figures
Figure 1
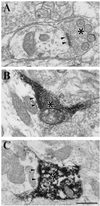
Examples of RD terminals (asterisks) and their synaptic contact zones (arrowheads) in the A laminae of the cat lateral geniculate nucleus. (A) Unlabeled RD terminal. (B) Corticogeniculate terminal labeled with biocytin. (C) Brainstem terminal labeled with antibody directed against ChAT. (Bar = 0.5 μm for A_–_C.)
Figure 2
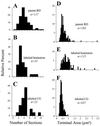
Measurements of synaptic terminals for parent RD terminals (i.e., the larger population from which cholinergic brainstem and corticogeniculate terminals are drawn), brainstem terminals labeled for ChAT or BNOS, and corticogeniculate terminals labeled with biocytin. (A_–_C) Frequency histograms indicating the extent of the synaptic contact zones. For each of the terminals, the contact zone was serially reconstructed to derive the number of serial sections needed to contain the reconstructed synaptic contact zone. (D_–_F) Frequency histograms for each terminal type showing their cross-sectional areas. The numbers of terminals in each sample are indicated, and the terminals represented in A_–_C are a subset of those in D_–_F.
Figure 3
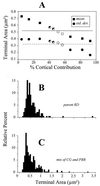
Determination of the mixture of labeled brainstem and corticogeniculate terminals needed to reconstruct the size distribution of parent RD terminals. (A) Means (squares) and SD (circles) of the cross-sectional areas of the terminal populations constructed from various mixtures of corticogeniculate and brainstem terminals (see text for details). Each point represents the average of three independent sampling algorithms whereby corticogeniculate and brainstem terminals were randomly selected for the mixtures. The percentages of corticogeniculate terminals indicated on the abscissa have been corrected for the sampling bias favoring them over brainstem terminals, and thus these values represent X′ as described in the text. The horizontal lines represent the mean (solid line) and SD (dashed line) of the target population of parent RD terminals. Completely filled squares and circles indicate that the mixtures of corticogeniculate and brainstem terminals are significantly different from the parent RD population in terms of cross-sectional area, open symbols indicate that each of the three mixtures is statistically indistinguishable from the parent RD population, and half-filled symbols indicate that some of the mixtures are different from the parent RD population whereas others are not. (B) Terminal size distribution of parent RD population (redrawn from Fig. 2_D_). (C) Size distribution of combination of all six mixtures of 49% and 53% corticogeniculate terminals, mixtures that were statistically indistinguishable from the parent RD population.
Similar articles
- Development of corticogeniculate synapses in the cat.
Weber AJ, Kalil RE. Weber AJ, et al. J Comp Neurol. 1987 Oct 8;264(2):171-92. doi: 10.1002/cne.902640204. J Comp Neurol. 1987. PMID: 3680627 - The control of retinogeniculate transmission in the mammalian lateral geniculate nucleus.
Sherman SM, Koch C. Sherman SM, et al. Exp Brain Res. 1986;63(1):1-20. doi: 10.1007/BF00235642. Exp Brain Res. 1986. PMID: 3015651 Review. - How much feedback from visual cortex to lateral geniculate nucleus in cat: a perspective.
Budd JM. Budd JM. Vis Neurosci. 2004 Jul-Aug;21(4):487-500. doi: 10.1017/S0952523804214018. Vis Neurosci. 2004. PMID: 15579216 Review.
Cited by
- Effect of acetylcholine deficiency on neural oscillation in a brainstem-thalamus-cortex neurocomputational model related with Alzheimer's disease.
Yang H, Yang X, Yan S, Sun Z. Yang H, et al. Sci Rep. 2022 Sep 2;12(1):14961. doi: 10.1038/s41598-022-19304-3. Sci Rep. 2022. PMID: 36056083 Free PMC article. - Thalamic circuitry and thalamocortical synchrony.
Jones EG. Jones EG. Philos Trans R Soc Lond B Biol Sci. 2002 Dec 29;357(1428):1659-73. doi: 10.1098/rstb.2002.1168. Philos Trans R Soc Lond B Biol Sci. 2002. PMID: 12626002 Free PMC article. Review. - Comparison of synaptic transmission and plasticity between sensory and cortical synapses on relay neurons in the ventrobasal nucleus of the rat thalamus.
Hsu CL, Yang HW, Yen CT, Min MY. Hsu CL, et al. J Physiol. 2010 Nov 15;588(Pt 22):4347-63. doi: 10.1113/jphysiol.2010.192864. Epub 2010 Sep 20. J Physiol. 2010. PMID: 20855435 Free PMC article. - The absence of retinal input disrupts the development of cholinergic brainstem projections in the mouse dorsal lateral geniculate nucleus.
Sokhadze G, Seabrook TA, Guido W. Sokhadze G, et al. Neural Dev. 2018 Dec 12;13(1):27. doi: 10.1186/s13064-018-0124-7. Neural Dev. 2018. PMID: 30541618 Free PMC article. - Interactions between membrane conductances underlying thalamocortical slow-wave oscillations.
Destexhe A, Sejnowski TJ. Destexhe A, et al. Physiol Rev. 2003 Oct;83(4):1401-53. doi: 10.1152/physrev.00012.2003. Physiol Rev. 2003. PMID: 14506309 Free PMC article. Review.
References
- Guillery R W. Z Zellforsch Mikrosk Anat. 1969;96:39–48. - PubMed
- Sherman S M, Koch C. In: The Synaptic Organization of the Brain. 3rd Ed. Shepherd G M, editor. New York: Oxford Univ. Press; 1990. pp. 246–278.
- Somogyi J, Hámori J, Silakov V L. Exp Brain Res. 1984;54:485–498. - PubMed
- Wilson J R, Friedlander M J, Sherman S M. Proc R Soc London, Ser B. 1984;221:411–436. - PubMed
- Sherman S M, Guillery R W. J Neurophysiol. 1996;76:1367–1395. - PubMed
Publication types
MeSH terms
Substances
LinkOut - more resources
Full Text Sources
Miscellaneous


