CD80 (B7-1) binds both CD28 and CTLA-4 with a low affinity and very fast kinetics - PubMed (original) (raw)
CD80 (B7-1) binds both CD28 and CTLA-4 with a low affinity and very fast kinetics
P A van der Merwe et al. J Exp Med. 1997.
Abstract
The structurally related T cell surface molecules CD28 and CTLA-4 interact with cell surface ligands CD80 (B7-1) and CD86 (B7-2) on antigen-presenting cells (APC) and modulate T cell antigen recognition. Preliminary reports have suggested that CD80 binds CTLA-4 and CD28 with affinities (Kd values approximately 12 and approximately 200 nM, respectively) that are high when compared with other molecular interactions that contribute to T cell-APC recognition. In the present study, we use surface plasmon resonance to measure the affinity and kinetics of CD80 binding to CD28 and CTLA-4. At 37 degrees C, soluble recombinant CD80 bound to CTLA-4 and CD28 with Kd values of 0.42 and 4 microM, respectively. Kinetic analysis indicated that these low affinities were the result of very fast dissociation rate constants (k(off)); sCD80 dissociated from CD28 and CTLA-4 with k(off) values of > or = 1.6 and > or = 0.43 s-1, respectively. Such rapid binding kinetics have also been reported for the T cell adhesion molecule CD2 and may be necessary to accommodate-dynamic T cell-APC contacts and to facilitate scanning of APC for antigen.
Figures
Figure 1
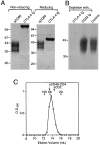
Biochemical analysis of sCD80 and CTLA-4 Ig. (A) sCD80 and CTLA-4 Ig (2.5 μg each) were analyzed by SDS-PAGE on 10% acrylamide under nonreducing and reducing (+βME) conditions. The migration positions of the indicated (in kD) molecular mass markers are shown. (B) Measuring the binding activity of sCD80. Protein A–sepharose beads coated with CTLA-4 Ig or CD22 Ig were incubated with soluble sCD80, pelleted, and the supernatant analyzed for the presence of sCD80 by reducing SDS-PAGE on 12% acrylamide, together with sCD80 not exposed to beads (Control). (C) Analysis of sCD80 by size-exclusion chromatography. sCD80 (2.1 mg in 0.5 ml) was run on a SUPERDEX S200 HR10/30 column (Pharmacia) at 0.5 ml/min. The calibration markers shown (Sigma) were alcohol dehydrogenase (M r 150,000), BSA (M r 66,000), and carbonic anhydrase (M r 29,000). sCD48–CD4 and sCD2 are described in the text.
Figure 4
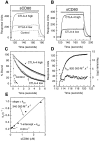
Estimating the k on and k off for sCD80 binding CTLA-4 Ig. (A) Example of primary data. sCD80 (265 nM) was injected (solid bar) at 40 μl/min through FCs with nothing immobilized (Control) or CTLA-4 immobilized at low (920 RUs) or high (2500 RUs) levels. (B) Effect of varying the flow rate. sCD80 (265 nM) was injected (solid bar) at 20 (solid line) or 40 (stippled line) μl/min through FCs with high or low levels of CTLA-4. Background responses (following injection through a control FC) have been subtracted. (C) Dissociation of sCD80 from FC with high (•, ○) or low (▴, ▵) levels of CTLA-4 Ig at flow rate of 20 (•, ▴, ▪) or 40 (○, ▵, □) μl/min. Also shown is the fall in response in the same period following injection of sCD80 through control FC (▪, □). The data fitted reasonably well to single exponential decay curves (dotted lines), yielding the following t1/2 values: •, 4.8 s; ○, 4.4 s; ▴, 2.2 s; ▵, 2.35 s; ▪, 0.16 s; □, 0.075 s. (D) Estimating the k on. Equation 1 (see Materials and Methods) was fitted (solid line) to data (•) from (B) (corresponding to binding of sCD80 to CTLA-4 [low level] at 40 μl/min), yielding the indicated residuals (▪) and k on. (E) Independent estimation of k on and k off by analysis of binding at different sCD80 concentrations. The rate at which the binding rate decreases (−k s) during the injection phase was determined for a range of injected sCD80 concentrations (see Materials and Methods [43]) using data from Fig. 2_A._ A linear regression fit of equation 2 to a plot of k s versus sCD80 concentration yielded the k on and k off values.
Figure 2
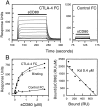
Measuring the affinity of sCD80 binding to CTLA-4 Ig by equilibrium binding. (A) A range of sCD80 concentrations (2.65 μM and nine twofold dilutions thereof) were injected sequentially (solid bar) for 2 min at 10 μl/min through a flow cell (FC) with either CTLA-4 Ig (1,500 RUs) or no protein (Control) immobilized. sCD80 (0.26 μM) bound to a very similar level (255 and 250 RUs) when injected at the beginning and end of the experiment (data not shown), indicating that the immobilized CTLA-4 Ig was stable. (B) The equilibrium responses in the CTLA-4 Ig (•) and Control (▴) FCs at each sCD80 concentration and the differences between these responses (representing actual binding, ▪) are plotted. The dotted line represents a nonlinear fit of the Langmuir binding isotherm to the binding data and yields a K d of 0.4 μM and a binding maximum of 774 RUs. A Scatchard plot of the same data is shown on the right. A linear regression fit yields a K d of 0.4 μM and a binding maximum of 750 RUs.
Figure 3
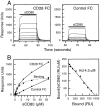
Measuring the affinity of sCD80 binding to CD28 Ig by equilibrium binding. (A) A range of sCD80 concentrations (26.5 μM and eight twofold dilutions thereof) were injected sequentially (solid bar) for 30 s at 10 μl/min through a FC with either CD28 Ig (immobilized at a level of 7800 RUs) or an irrelevant protein (Control) immobilized. sCD80 (0.82 μM) injected at the beginning and end of the experiment bound to a very similar level (160 and 157 RUs), indicating that the immobilized CD28 Ig was stable. (B) The equilibrium responses in the CD28 Ig (•) and Control (▴) FCs at each sCD80 concentration and the differences between these responses (representing actual binding, ▪) are plotted. The dotted line represents a nonlinear fit of the Langmuir binding isotherm to the binding data and yields a K d of 4.1 μM and a binding maximum of 939 RUs. A Scatchard plot of the same data is shown on the right. A linear regression fit yields a K d of 4.3 μM and a binding maximum of 952 RUs.
Figure 5
Estimating the k on and k off for sCD80 binding CD28 Ig. (A) Example of primary data. sCD80 (2.65 μM) was injected (solid bar) at 80 μl/min through FCs with nothing immobilized (Control) or CD28 Ig immobilized at low (3400 RUs) or high (6200 RUs) levels. (B) Effect of varying the flow rate. sCD80 (2.65 μM) was injected (solid bar) at 40 (solid line) or 80 (stippled line) μl/min through FCs with high or low levels of CD28 Ig. Background responses (following injection through a control FC) have been subtracted. (C) Dissociation of sCD80 from FC with high (•, ○) or low (▴, ▵) levels of CD28 Ig at flow rate of 40 (•, ▴, ▪) or 80 (○, ▵, □) μl/min. Also shown is the fall in response in the same period following injection of sCD80 through a control FC (▪, □). The data fitted well to single exponential decay curves (dotted lines), yielding the following t1/2 values: •, 0.93 s; ○, 0.84 s; ▴, 0.69 s; Δ, 0.64 s; ▪, 0.075 s; □, 0.04 s. (D) Obtaining the k on by nonlinear curve fitting. Eq. 1 (see Materials and Methods) was fitted (solid line) to data (•) from (B) (corresponding to binding of sCD80 to CD28 Ig [low level] at 80 μl/min), yielding the indicated residuals (▪) and k on.
Figure 6
Comparison of avidity of CD28 Ig and CTLA-4 Ig binding to immobilized sCD80. CD28 Ig or CTLA-4 Ig were injected at 5 μl/ min (25°C) at the indicated concentration for 6–8 min through FC with either sCD80 (3300 RU) or no protein (Control) immobilized. The responses seen with injection of the three CTLA4 Ig concentrations through the Control FC were indistinguishable when superimposed.
Similar articles
- Covalent dimerization of CD28/CTLA-4 and oligomerization of CD80/CD86 regulate T cell costimulatory interactions.
Greene JL, Leytze GM, Emswiler J, Peach R, Bajorath J, Cosand W, Linsley PS. Greene JL, et al. J Biol Chem. 1996 Oct 25;271(43):26762-71. doi: 10.1074/jbc.271.43.26762. J Biol Chem. 1996. PMID: 8900156 - Human B7-1 (CD80) and B7-2 (CD86) bind with similar avidities but distinct kinetics to CD28 and CTLA-4 receptors.
Linsley PS, Greene JL, Brady W, Bajorath J, Ledbetter JA, Peach R. Linsley PS, et al. Immunity. 1994 Dec;1(9):793-801. doi: 10.1016/s1074-7613(94)80021-9. Immunity. 1994. PMID: 7534620 - Regulation of T and B cell responses by modulating interactions between CD28/CTLA4 and their ligands, CD80 and CD86.
Lane P. Lane P. Ann N Y Acad Sci. 1997 Apr 5;815:392-400. doi: 10.1111/j.1749-6632.1997.tb52090.x. Ann N Y Acad Sci. 1997. PMID: 9186685 Review. - The role of CTLA-4 in the regulation and initiation of T-cell responses.
Chambers CA, Krummel MF, Boitel B, Hurwitz A, Sullivan TJ, Fournier S, Cassell D, Brunner M, Allison JP. Chambers CA, et al. Immunol Rev. 1996 Oct;153:27-46. doi: 10.1111/j.1600-065x.1996.tb00919.x. Immunol Rev. 1996. PMID: 9010718 Review. No abstract available.
Cited by
- Structure and interactions of the human programmed cell death 1 receptor.
Cheng X, Veverka V, Radhakrishnan A, Waters LC, Muskett FW, Morgan SH, Huo J, Yu C, Evans EJ, Leslie AJ, Griffiths M, Stubberfield C, Griffin R, Henry AJ, Jansson A, Ladbury JE, Ikemizu S, Carr MD, Davis SJ. Cheng X, et al. J Biol Chem. 2013 Apr 26;288(17):11771-85. doi: 10.1074/jbc.M112.448126. Epub 2013 Feb 15. J Biol Chem. 2013. PMID: 23417675 Free PMC article. - _trans_-Interacting Plasma Membrane Proteins and Binding Partner Identification.
Zhang S, Ma Z. Zhang S, et al. J Proteome Res. 2024 Aug 2;23(8):3322-3331. doi: 10.1021/acs.jproteome.4c00289. Epub 2024 Jun 27. J Proteome Res. 2024. PMID: 38937710 Free PMC article. Review. - Immune Tolerance Induction against Experimental Autoimmune Encephalomyelitis (EAE) Using A New PLP-B7AP Conjugate that Simultaneously Targets B7/CD28 Costimulatory Signal and TCR/MHC-II Signal.
Badawi AH, Kiptoo P, Siahaan TJ. Badawi AH, et al. J Mult Scler (Foster City). 2015 Dec;2(1):1000131. doi: 10.4172/2376-0389.1000131. J Mult Scler (Foster City). 2015. PMID: 26140285 Free PMC article. - CTLA-4 interacts with STAT5 and inhibits STAT5-mediated transcription.
Srahna M, Van Grunsven LA, Remacle JE, Vandenberghe P. Srahna M, et al. Immunology. 2006 Mar;117(3):396-401. doi: 10.1111/j.1365-2567.2005.02313.x. Immunology. 2006. PMID: 16476059 Free PMC article. - Cytotoxic T lymphocyte antigen 4 (CTLA-4) engagement delivers an inhibitory signal through the membrane-proximal region in the absence of the tyrosine motif in the cytoplasmic tail.
Nakaseko C, Miyatake S, Iida T, Hara S, Abe R, Ohno H, Saito Y, Saito T. Nakaseko C, et al. J Exp Med. 1999 Sep 20;190(6):765-74. doi: 10.1084/jem.190.6.765. J Exp Med. 1999. PMID: 10499915 Free PMC article.
References
- Hansen JA, Martin PJ, Nowinski RC. Monoclonal antibodies identifying a novel T-cell antigen and Ia antigen of human lymphocytes. Immunogenetics. 1980;10:247–260.
- Brunet JF, Denizot F, Luciani MF, Roux-Dosseto M, Suzan M, Mattei MG, Golstein P. A new member of the immunoglobulin superfamily-CTLA-4. Nature (Lond) 1987;328:267–270. - PubMed
- Linsley PS, Ledbetter JA. The role of the CD28 receptor during T cell responses to antigen. Annu Rev Immunol. 1993;11:191–211. - PubMed
- June CH, Bluestone JA, Nadler LM, Thompson CB. The B7 and CD28 receptor families. Immunol Today. 1994;15:321–331. - PubMed
Publication types
MeSH terms
Substances
LinkOut - more resources
Full Text Sources
Other Literature Sources


