The enigmatic plasmacytoid T cells develop into dendritic cells with interleukin (IL)-3 and CD40-ligand - PubMed (original) (raw)
The enigmatic plasmacytoid T cells develop into dendritic cells with interleukin (IL)-3 and CD40-ligand
G Grouard et al. J Exp Med. 1997.
Free PMC article
Abstract
A subset of CD4+CD11c-CD3- blood cells was recently shown to develop into dendritic cells when cultured with monocyte conditioned medium. Here, we demonstrate that CD4+ CD11c-CD3- cells, isolated from tonsils, correspond to the so-called plasmacytoid T cells, an obscure cell type that has long been observed by pathologists within secondary lymphoid tissues. They express CD45RA, but not markers specific for known lymphoid- or myeloid-derived cell types. They undergo rapid apoptosis in culture, unless rescued by IL-3. Further addition of CD40-ligand results in their differentiation into dendritic cells that express low levels of myeloid antigens CD13 and CD33.
Figures
Figure 1
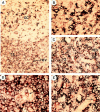
Anatomical localization of CD4+CD11c−CD3− plasmacytoid cells. To distinguish CD4+CD11c−CD3− plasmacytoid cells from CD4+CD3+ T cells and CD4+CD11c+ germinal center dendritic cells, double staining with anti-CD3 (blue), anti-CD11c (blue), and anti-CD4 (red) on tonsillar sections was performed. Accordingly, whereas CD4+CD3+ T cells and CD4+CD11c+ germinal center dendritic cells should be double stained purple, CD4+CD11c−CD3− plasmacytoid cells should be single stained red. (A) shows a germinal center and its adjacent T cell–rich extrafollicular areas containing HEV. Red CD4+CD11c−CD3− plasmacytoid cells can only be found in T cell area but not in germinal center. (B) shows that the same germinal center displayed in A does not contain red CD4+CD11c−CD3− plasmacytoid cells. (C) shows that the same T cell area displayed in A contains many red CD4+CD11c−CD3− plasmacytoid cells, located within or around HEV. (D) shows a red CD4+ CD11c−CD3− plasmacytoid cell within the lumen of HEV. (E) shows many red CD4+CD11c−CD3− plasmacytoid cells, one in particular is within the endothelial wall of HEV. Original magnification: (A) ×100; (B, C) ×200; (D, E) ×400.
Figure 2
Cell sorting of CD4+CD11c−CD3− plasmacytoid cells. After preparation of tonsillar cells that are negative for CD3, CD14, CD19, CD20, and CD56 (detailed in Materials and Methods), cells were stained with mouse anti–CD4-PE-Cy5 (Immunotech), anti–CD11c-PE (Becton Dickinson), and a cocktail of FITC-labeled mAbs anti-CD3 and CD34 (Immunotech), anti-CD20, anti-CD57, anti-CD7 and anti-CD16 (Becton Dickinson), and anti-CD1a (Ortho). As shown in the left panel, cells were first selected by their cocktail FITC− (Lin−). This selected population contains CD4+CD11c+ germinal center dendritic cells (14) and CD4+ CD11c− plasmacytoid cells, as shown in the right panel.
Figure 3
Morphology of freshly isolated CD4+CD11c−CD3− plasmacytoid cells. (A) Giemsa staining; (B) SEM; (C) TEM; (D) TEM. (E) negative antiIg κ+λ light chain staining of CD4+CD11c−Lin− plasmacytoid cells; (F) positive anti-Ig κ+λ light chain staining of CD38++CD20− Ig–secreting plasma cells. Original magnification: (A, F) ×1,000; (B) ×3,500; (C) ×2,000; (D) ×8,000.
Figure 4
Surface phenotype of isolated CD4+CD11c−CD3− plasmacytoid cells analyzed by flow cytometry. Filled histograms represent isotype matched controls, open histograms represent staining with specific antibodies. Data shown are one representative of six experiments.
Figure 5
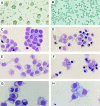
CD4+CD11c−CD3− plasmacytoid cells undergo rapid apoptosis when cultured in medium, unless rescued by IL-3. (A) Many cell clusters at 4 h of culture with IL-3; (B) Dispersed cells at 4 h of culture in medium alone; (C) Few apoptotic cells within clusters at 4 h of culture with IL-3; (D) Many apoptotic cells at 4 h of culture in medium alone; (E) Cells display pseudopods at 16 h of culture with IL-3; (F). All cells are dead at 16 h of culture in medium; (G) Mitotic figures at 3 d of culture with IL-3; (H) cells with pseudopods at 6 d of culture with IL-3. Data shown are one representative of six experiments. Original magnification: (B) ×200.
Figure 6
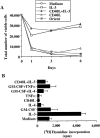
IL-3 maintains the viability of CD4+CD11c−CD3− plasmacytoid cells for up to 6 d. (A) Total numbers of viable cells at day 1, day 3, and day 6 of culture with medium (open circles), IL-3 (open squares), CD40ligand transfected L cells (open triangles), CD40-ligand negative L cells = ORIENT (solid squares) and CD40-ligand transfected L cells plus IL-3 (solid triangles). (B) IL-3 induces [3H]thymidine incorporation by plasmacytoid cells at day 3 of culture. Data shown are one representative of four experiments.
Figure 7
CD4+CD11c−CD3− plasmacytoid cells acquire the morphology of mature interdigitating dendritic cells after 6 d of culture with IL-3 and CD40-ligand. (A) Culture morphology; (B) Giemsa staining; (C) SEM; (D) TEM. Original magnification: (A) ×100; (B) ×400; (C) ×3,000; (D) ×6,000.
Figure 8
CD4+CD11c−CD3− plasmacytoid cells express high levels of costimulatory molecules, but few myeloid antigens, after 6 d of culture with IL-3 or IL-3+CD40-ligand. Filled histograms represent isotype matched controls, open histograms represent staining with specific antibodies. Data shown are one representative of six experiments.
Figure 9
Dendritic cells derived from CD4+CD11c−CD3− plasmacytoid cells after 6 d of culture with IL-3+CD40-ligand did not uptake FITC-dextran. Methods are as described by Sallusto et al. (11). Time 0 represents cells that were incubated with FITC–dextran for 30 min at 4°C. After three washes, the FITC–dextran uptake by plasmacytoid cells derived DC cultured with IL-3 (open squares) or with IL-3 plus CD40ligand (solid circles) and monocyte-derived DC (solid triangles) at 37°C were analyzed with a FACScan® flow cytometer. MFI, mean fluorescence intensity. Data shown are one representative of three experiments.
Figure 10
DC derived from CD4+CD11c−CD3− plasmacytoid cells induces strong proliferation of CD4+CD45RA+ naive T cells. Purified allogeneic blood CD4+CD45RA+ naive T cells were cocultured with different numbers of DC generated from: CD14+ monocyte–derived DCs (solid circle), CD34+ progenitor–derived DCs (solid square), plasmacytoid cells after 6 d of culture with IL-3 (open square) and plasmacytoid cells after 6 d of culture with IL-3 and CD40L (open circle). After 5 d of DC-T cell cocultures, cells were pulsed with 1 μCi [3H]thymidine for 8 h before harvesting and counting. Data shown are one representative of six experiments.
Similar articles
- Identification of both myeloid CD11c+ and lymphoid CD11c- dendritic cell subsets in cord blood.
Borràs FE, Matthews NC, Lowdell MW, Navarrete CV. Borràs FE, et al. Br J Haematol. 2001 Jun;113(4):925-31. doi: 10.1046/j.1365-2141.2001.02840.x. Br J Haematol. 2001. PMID: 11442485 - Identification of CD68+lin- peripheral blood cells with dendritic precursor characteristics.
Strobl H, Scheinecker C, Riedl E, Csmarits B, Bello-Fernandez C, Pickl WF, Majdic O, Knapp W. Strobl H, et al. J Immunol. 1998 Jul 15;161(2):740-8. J Immunol. 1998. PMID: 9670950 - CD11c(+)B220(+)Gr-1(+) cells in mouse lymph nodes and spleen display characteristics of plasmacytoid dendritic cells.
Nakano H, Yanagita M, Gunn MD. Nakano H, et al. J Exp Med. 2001 Oct 15;194(8):1171-8. doi: 10.1084/jem.194.8.1171. J Exp Med. 2001. PMID: 11602645 Free PMC article. - Plasmacytoid monocytes/T cells: a dendritic cell lineage?
Galibert L, Maliszewski CR, Vandenabeele S. Galibert L, et al. Semin Immunol. 2001 Oct;13(5):283-9. doi: 10.1006/smim.2001.0324. Semin Immunol. 2001. PMID: 11502163 Review. - Origin and filiation of human plasmacytoid dendritic cells.
Brière F, Bendriss-Vermare N, Delale T, Burg S, Corbet C, Rissoan MC, Chaperot L, Plumas J, Jacob MC, Trinchieri G, Bates EE. Brière F, et al. Hum Immunol. 2002 Dec;63(12):1081-93. doi: 10.1016/s0198-8859(02)00746-2. Hum Immunol. 2002. PMID: 12480251 Review.
Cited by
- Immunological cells and functions in Gaucher disease.
Pandey MK, Grabowski GA. Pandey MK, et al. Crit Rev Oncog. 2013;18(3):197-220. doi: 10.1615/critrevoncog.2013004503. Crit Rev Oncog. 2013. PMID: 23510064 Free PMC article. Review. - Human mesothelioma induces defects in dendritic cell numbers and antigen-processing function which predict survival outcomes.
Cornwall SM, Wikstrom M, Musk AW, Alvarez J, Nowak AK, Nelson DJ. Cornwall SM, et al. Oncoimmunology. 2015 Aug 31;5(2):e1082028. doi: 10.1080/2162402X.2015.1082028. eCollection 2016 Feb. Oncoimmunology. 2015. PMID: 27057464 Free PMC article. - Dendritic cell-based vaccines: barriers and opportunities.
Cintolo JA, Datta J, Mathew SJ, Czerniecki BJ. Cintolo JA, et al. Future Oncol. 2012 Oct;8(10):1273-99. doi: 10.2217/fon.12.125. Future Oncol. 2012. PMID: 23130928 Free PMC article. Review. - Migration of tumor antigen-pulsed dendritic cells after mucosal administration in the human upper respiratory tract.
Horiguchi S, Matsuoka T, Okamoto Y, Sakurai D, Kobayashi K, Chazono H, Hanazawa T, Tanaka Y. Horiguchi S, et al. J Clin Immunol. 2007 Nov;27(6):598-604. doi: 10.1007/s10875-007-9112-0. Epub 2007 Jun 28. J Clin Immunol. 2007. PMID: 17597385 - Human dendritic cells mediate cellular apoptosis via tumor necrosis factor-related apoptosis-inducing ligand (TRAIL).
Fanger NA, Maliszewski CR, Schooley K, Griffith TS. Fanger NA, et al. J Exp Med. 1999 Oct 18;190(8):1155-64. doi: 10.1084/jem.190.8.1155. J Exp Med. 1999. PMID: 10523613 Free PMC article.
References
- Lennert K, Kaiserling E, Müller-Hermelink HK. T-associated plasma cells. Lancet. 1975;1:1031–1032. - PubMed
- Lennert, K., H. Stein, H.K. Müller-Hermelink, and R. Vollenweider. 1984. T cells with plasmacytoid features. In Leucocyte Typing. Human Leucocyte Differentiation Antigens Detected by Monoclonal Antibodies. A. Bernard, L. Boumsell, J. Dausset, C. Milstein and S.F. Schlossman, editors. Springer-Verlag, Berlin.
- Papadimitriou CS, Stephanaki-Nikou SN, Malamou-Mitsi VD. Comparative immunostaining of T-associated plasma cells and other lymph-node cells in paraffin section. Virchows Arch (Cell Pathol) 1983;43:31–36. - PubMed
- Horny HP, Feller AC, Horst HA, Lennert K. Immunocytology of plasmacytoid T cells: marker analysis indicates a unique phenotype of this enigmatic cell. Hum Pathol. 1986;18:28–32. - PubMed
- Facchetti F, de Wolf-Peeters C. The plasmacytoid monocyte (the so called plasmacytoid T-cell). An enigmatic cell of the human lymphoid tissue. Biotest Bulletin. 1991;4:225–240.
Publication types
MeSH terms
Substances
LinkOut - more resources
Full Text Sources
Other Literature Sources
Research Materials
Miscellaneous


