Mutant N-RAS induces erythroid lineage dysplasia in human CD34+ cells - PubMed (original) (raw)
Mutant N-RAS induces erythroid lineage dysplasia in human CD34+ cells
R L Darley et al. J Exp Med. 1997.
Abstract
RAS mutations arise at high frequency (20-40%) in both acute myeloid leukemia and myelodysplastic syndrome (which is considered to be a manifestation of preleukemic disease). In each case, mutations arise predominantly at the N-RAS locus. These observations suggest a fundamental role for this oncogene in leukemogenesis. However, despite its obvious significance, little is known of how this key oncogene may subvert the process of hematopoiesis in human cells. Using CD34+ progenitor cells, we have modeled the preleukemic state by infecting these cells with amphotropic retrovirus expressing mutant N-RAS together with the selectable marker gene lacZ. Expression of the lacZ gene product, beta-galactosidase, allows direct identification and study of N-RAS-expressing cells by incubating infected cultures with a fluorogenic substrate for beta-galactosidase, which gives rise to a fluorescent signal within the infected cells. By using multiparameter flow cytometry, we have studied the ability of CD34+ cells expressing mutant N-RAS to undergo erythroid differentiation induced by erythropoietin. By this means, we have found that erythroid progenitor cells expressing mutant N-RAS exhibit a proliferative defect resulting in an increased cell doubling time and a decrease in the proportion of cells in S + G2M phase of the cell cycle. This is linked to a slowing in the rate of differentiation as determined by comparative cell-surface marker analysis and ultimate failure of the differentiation program at the late-erythroblast stage of development. The dyserythropoiesis was also linked to an increased tendency of the RAS-expressing cells to undergo programmed cell death during their differentiation program. This erythroid lineage dysplasia recapitulates one of the most common features of myelodysplastic syndrome, and for the first time provides a causative link between mutational activation of N-RAS and the pathogenesis of preleukemia.
Figures
Figure 10
Morphology of _RAS_-expressing erythroid cells. (A) Control-infected cells purified by cell sorting, (B–C) corresponding _RAS_-infected cells. PE, proerythroblast; IE, intermediate erythroblast; LE, late erythroblast; AP, apoptotic cell. Original magnification, ×1000.
Figure 10
Morphology of _RAS_-expressing erythroid cells. (A) Control-infected cells purified by cell sorting, (B–C) corresponding _RAS_-infected cells. PE, proerythroblast; IE, intermediate erythroblast; LE, late erythroblast; AP, apoptotic cell. Original magnification, ×1000.
Figure 10
Morphology of _RAS_-expressing erythroid cells. (A) Control-infected cells purified by cell sorting, (B–C) corresponding _RAS_-infected cells. PE, proerythroblast; IE, intermediate erythroblast; LE, late erythroblast; AP, apoptotic cell. Original magnification, ×1000.
Figure 2
Expression of β-galactosidase after infection of CD34+ cells. Mock-infected cells (open histograms) indicate the threshold for positivity. These data represent β-galactosidase expression after a 3 d induction with EPO.
Figure 3
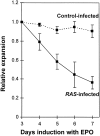
Relative expansion of β-galactosidase positive cells after induction with EPO. The data have been normalized relative to expression after a 3 d induction with EPO. The mean of six separate experiments is shown; error bars indicate ± SD.
Figure 1
Northern analysis of N-RAS expression. Lane 1, 181-7 packaging line (positive control); lane 2, K562-lacZ cells; lane 3, K562_-N-RAS-lacZ_ cells. The upper panel demonstrates the expression of the lacZ-N-RAS transcript of the expected size. The lower panel shows the same blot reprobed with β-actin.
Figure 4
Effect of mutant N-RAS expression on cell cycle distribution. Representative histograms are shown from one of four experiments. Filled histograms represent infected cells (β-galactosidase positive); open histograms show uninfected cells (β-galactosidase negative) within the same culture. Values indicate the proportion of cells in S + G2M ± SD. **P <0.001.
Figure 5
Frequency of apoptotic cells. (A) Frequency as defined by staining with annexin V. Infected and uninfected cells within each culture were separately analyzed; only _RAS_-expressing cells showed enhanced frequency of apoptotic cells (**P <0.001). (B) Frequency as defined by morphological assessment of infected cells (*P <0.05). In each case, the mean of four experiments is shown; error bars indicate ± SD.
Figure 6
Immunophenotypic analysis of cells before induction of differentiation with EPO. Representative histograms from one of four experiments are shown. Dashed histograms represent levels of control antibody staining. Mean percentage expression of each marker ± SD are indicated.
Figure 7
Effect of mutant N-RAS expression on cell-surface markers. Representative histograms from one of at least four experiments are shown for each marker. Dashed histograms represent levels of control antibody staining. Mean percentage expression of each marker ± SD, or in the case of CD71 and CD36, mean fluorescence intensity ± SD are indicated. *significant difference P <0.05, **P <0.001.
Figure 8
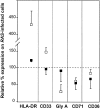
Immunophenotype of _RAS_-expressing cells compared with control values after 5- and 7-d induction with EPO. Open symbols, _RAS_-expressing cells after 5-d induction; closed symbols, _RAS_-expressing cells after 7-d induction. Expression levels have been normalized to that of control cells after 5-d induction with EPO (100%). Data are based on mean percentage expression in the case of HLA-DR, CD33, and gly A and mean fluorescence intensity in the case of CD71 and CD36. Means of at least three experiments are shown for each marker; error bars indicate SD.
Figure 9
Differential counts of erythroid morphology. _RAS_-infected cells (solid bars) and control-infected cells (open bars). Data show the mean of two experiments; error bars indicate ± SD. * significant difference P <0.05.
Similar articles
- Protein kinase C mediates mutant N-Ras-induced developmental abnormalities in normal human erythroid cells.
Darley RL, Pearn L, Omidvar N, Sweeney M, Fisher J, Phillips S, Hoy T, Burnett AK. Darley RL, et al. Blood. 2002 Dec 1;100(12):4185-92. doi: 10.1182/blood-2002-05-1358. Epub 2002 Jul 18. Blood. 2002. PMID: 12393454 - N-ras oncogene-induced gene expression in human hematopoietic progenitor cells: upregulation of p16INK4a and p21CIP1/WAF1 correlates with myeloid differentiation.
Shen S, Passioura T, Symonds G, Dolnikov A. Shen S, et al. Exp Hematol. 2007 Jun;35(6):908-19. doi: 10.1016/j.exphem.2007.02.011. Exp Hematol. 2007. PMID: 17533045 Clinical Trial. - Genetic lesions in preleukemia.
Carter G, Ridge S, Padua RA. Carter G, et al. Crit Rev Oncog. 1992;3(4):339-64. Crit Rev Oncog. 1992. PMID: 1420444 Review. - [Activation of ras oncogene in myelodysplastic syndrome and acute myelogenous leukemia].
Hirai H, Hirano N, Yazaki Y. Hirai H, et al. Gan To Kagaku Ryoho. 1991 Jun;18(7):1090-7. Gan To Kagaku Ryoho. 1991. PMID: 2053767 Review. Japanese.
Cited by
- Somatic activation of a conditional KrasG12D allele causes ineffective erythropoiesis in vivo.
Braun BS, Archard JA, Van Ziffle JA, Tuveson DA, Jacks TE, Shannon K. Braun BS, et al. Blood. 2006 Sep 15;108(6):2041-4. doi: 10.1182/blood-2006-01-013490. Epub 2006 May 23. Blood. 2006. PMID: 16720837 Free PMC article. - Insights into GATA-1-mediated gene activation versus repression via genome-wide chromatin occupancy analysis.
Yu M, Riva L, Xie H, Schindler Y, Moran TB, Cheng Y, Yu D, Hardison R, Weiss MJ, Orkin SH, Bernstein BE, Fraenkel E, Cantor AB. Yu M, et al. Mol Cell. 2009 Nov 25;36(4):682-95. doi: 10.1016/j.molcel.2009.11.002. Mol Cell. 2009. PMID: 19941827 Free PMC article. - Retroviral transduction of TLS-ERG initiates a leukemogenic program in normal human hematopoietic cells.
Pereira DS, Dorrell C, Ito CY, Gan OI, Murdoch B, Rao VN, Zou JP, Reddy ES, Dick JE. Pereira DS, et al. Proc Natl Acad Sci U S A. 1998 Jul 7;95(14):8239-44. doi: 10.1073/pnas.95.14.8239. Proc Natl Acad Sci U S A. 1998. PMID: 9653171 Free PMC article. - KRAS(G12V) enhances proliferation and initiates myelomonocytic differentiation in human stem/progenitor cells via intrinsic and extrinsic pathways.
Fatrai S, van Gosliga D, Han L, Daenen SM, Vellenga E, Schuringa JJ. Fatrai S, et al. J Biol Chem. 2011 Feb 25;286(8):6061-70. doi: 10.1074/jbc.M110.201848. Epub 2010 Dec 17. J Biol Chem. 2011. PMID: 21169357 Free PMC article. - Inducible expression of EVI1 in human myeloid cells causes phenotypes consistent with its role in myelodysplastic syndromes.
Konrad TA, Karger A, Hackl H, Schwarzinger I, Herbacek I, Wieser R. Konrad TA, et al. J Leukoc Biol. 2009 Oct;86(4):813-22. doi: 10.1189/jlb.0109042. Epub 2009 Jul 15. J Leukoc Biol. 2009. PMID: 19605700 Free PMC article.
References
- Barbacid M. Ras genes. Annu Rev Biochem. 1987;56:779–827. - PubMed
- Torti M, Marti KB, Altschuler D, Yamamoto K, Lapetina EG. Erythropoietin induces p21(ras) activation and p120GAP tyrosine phosphorylation in human erythroleukemia-cells. J Biol Chem. 1992;267:8293–8298. - PubMed
- Marshall MS. Ras target proteins in eukaryotic cells. FASEB J. 1995;9:1311–1318. - PubMed
- Kiaris H, Spandidos DA. Mutations of rasgenes in human tumours. Int J Oncol. 1995;7:413–421. - PubMed
Publication types
MeSH terms
Substances
LinkOut - more resources
Full Text Sources
Miscellaneous


