Targeted disruption of the mouse Stat3 gene leads to early embryonic lethality - PubMed (original) (raw)
Targeted disruption of the mouse Stat3 gene leads to early embryonic lethality
K Takeda et al. Proc Natl Acad Sci U S A. 1997.
Abstract
Signal transducer and activator of transcription (STAT) proteins have been shown to mediate biological actions in response to cytokines. Stat3, a member of the STAT family, is activated by a variety of cytokines, including the interleukin 6 family of cytokines, leptin, granulocyte colony-stimulating factor, and epidermal growth factor. To address the biological function of Stat3, we generated mice deficient in Stat3 by gene targeting. No viable Stat3-deficient mice could be obtained from heterozygote intercross. Analysis of embryos at several gestation times revealed that Stat3-deficient embryos showed a rapid degeneration between embryonic days 6.5 and 7.5, although they developed into the egg cylinder stage until embryonic day 6.0. These results demonstrate that Stat3 is essential for the early development of mouse embryos.
Figures
Figure 1
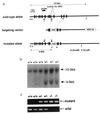
Disruption of the Stat3 gene. (a) The structure of the targeting vector and the mutated Stat3 gene. Restriction sites were: E, _Eco_RI; H, _Hin_dIII. (b) Southern blot analysis of the offspring from intercross of Stat3+/− mice. (c) PCR analysis of the microdissected embryonic tissues at E6.5. Primers a and b were used for detection of the wild-type allele, and a and c were used for the mutated allele.
Figure 2
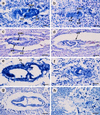
Histological analysis of wild-type and Stat3−/− embryos. Wild-type embryos (a, c, e, and g) and Stat3−/− embryos (b, d, f, and h) were dissected at E6.0 (a and b), E6.5 (c and d), E7.0 (e and f), and E7.5 (g and h). Note the rapid degeneration of Stat3−/− embryos from E6.5 to E7.5. Stat3−/− embryos formed a two-layered egg cylinder at E6.0 (b) but were degenerated rapidly and resorbed completely by E7.5 (d, f, and h). ee, embryonic ectoderm; m, mesoderm; pac, proamniotic cavity; and ve, visceral endoderm. [Bars = 40 μm (a_–_f) and 100 μm (g and h).]
Figure 3
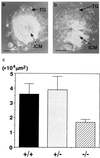
In vitro outgrowth of blastocysts. Blastocysts were cultured for 5 days, then photographed, lysed, and PCR-genotyped. (a) In vitro cultured wild-type blastocyst displaying outgrowth of trophoblast giant cells and ICM. (b) Cultured Stat3−/− blastocyst also displaying outgrowth of trophoblast giant cells and ICM, but the size of the ICM outgrowth was smaller than that of wild type. TG, trophoblast giant cell; ICM, inner cellular mass. (Bar = 40 μm.) (c) Graph of ICM outgrowth size. The shapes of ICM outgrowth were approximately ellipses, and surface areas were measured after 5 days of culture.
Similar articles
- Roles of STAT3 defined by tissue-specific gene targeting.
Akira S. Akira S. Oncogene. 2000 May 15;19(21):2607-11. doi: 10.1038/sj.onc.1203478. Oncogene. 2000. PMID: 10851059 Review. - IL-6-regulated transcription factors.
Akira S. Akira S. Int J Biochem Cell Biol. 1997 Dec;29(12):1401-18. doi: 10.1016/s1357-2725(97)00063-0. Int J Biochem Cell Biol. 1997. PMID: 9570135 Review. - STAT signaling is active during early mammalian development.
Duncan SA, Zhong Z, Wen Z, Darnell JE Jr. Duncan SA, et al. Dev Dyn. 1997 Feb;208(2):190-8. doi: 10.1002/(SICI)1097-0177(199702)208:2<190::AID-AJA6>3.0.CO;2-D. Dev Dyn. 1997. PMID: 9022056 - Multi-functional roles of Stat3 revealed by conditional gene targeting.
Takeda K, Akira S. Takeda K, et al. Arch Immunol Ther Exp (Warsz). 2001;49(4):279-83. Arch Immunol Ther Exp (Warsz). 2001. PMID: 11726030 Review.
Cited by
- pSTAT3 activation of Foxl2 initiates the female pathway underlying temperature-dependent sex determination.
Wu P, Wang X, Ge C, Jin L, Ding Z, Liu F, Zhang J, Gao F, Du W. Wu P, et al. Proc Natl Acad Sci U S A. 2024 Sep 10;121(37):e2401752121. doi: 10.1073/pnas.2401752121. Epub 2024 Sep 3. Proc Natl Acad Sci U S A. 2024. PMID: 39226347 - Pre-treatment of recombinant mouse MFG-E8 downregulates LPS-induced TNF-α production in macrophages via STAT3-mediated SOCS3 activation.
Aziz M, Jacob A, Matsuda A, Wu R, Zhou M, Dong W, Yang WL, Wang P. Aziz M, et al. PLoS One. 2011;6(11):e27685. doi: 10.1371/journal.pone.0027685. Epub 2011 Nov 15. PLoS One. 2011. PMID: 22114683 Free PMC article. - Pluripotency in the embryo and in culture.
Nichols J, Smith A. Nichols J, et al. Cold Spring Harb Perspect Biol. 2012 Aug 1;4(8):a008128. doi: 10.1101/cshperspect.a008128. Cold Spring Harb Perspect Biol. 2012. PMID: 22855723 Free PMC article. Review. - Induction of cell-cycle arrest and apoptosis in glioblastoma stem-like cells by WP1193, a novel small molecule inhibitor of the JAK2/STAT3 pathway.
Sai K, Wang S, Balasubramaniyan V, Conrad C, Lang FF, Aldape K, Szymanski S, Fokt I, Dasgupta A, Madden T, Guan S, Chen Z, Alfred Yung WK, Priebe W, Colman H. Sai K, et al. J Neurooncol. 2012 May;107(3):487-501. doi: 10.1007/s11060-011-0786-z. Epub 2012 Jan 17. J Neurooncol. 2012. PMID: 22249692 - Systematic Analysis of the Molecular Mechanism Underlying Decidualization Using a Text Mining Approach.
Liu JL, Wang TS. Liu JL, et al. PLoS One. 2015 Jul 29;10(7):e0134585. doi: 10.1371/journal.pone.0134585. eCollection 2015. PLoS One. 2015. PMID: 26222155 Free PMC article.
References
- Schindler C, Darnell J E., Jr Annu Rev Biochem. 1995;64:621–651. - PubMed
- Ihle J N. Cell. 1996;84:331–334. - PubMed
- Meraz M A, White J M, Sheehan K C F, Bach E A, Rodig S J, Dighe A S, Kaplan D H, Riley J K, Greenlund A C, Campbell D, Carver-Moore K, DuBois R N, Clark R, Aguet M, Schreiber R D. Cell. 1996;84:431–442. - PubMed
- Durbin J E, Hackenmiller R, Simon M C, Levy D E. Cell. 1996;84:443–450. - PubMed
- Takeda K, Tanaka T, Shi W, Matsumoto M, Minami M, Kashiwamura S, Nakanishi K, Yoshida N, Kishimoto T, Akira S. Nature (London) 1996;380:627–630. - PubMed
Publication types
MeSH terms
Substances
LinkOut - more resources
Full Text Sources
Other Literature Sources
Molecular Biology Databases
Miscellaneous


