Impairment of T cell development in deltaEF1 mutant mice - PubMed (original) (raw)
Impairment of T cell development in deltaEF1 mutant mice
Y Higashi et al. J Exp Med. 1997.
Abstract
Using the method of gene targeting in mouse embryonic stem cells, regulatory function of deltaEF1, a zinc finger and homeodomain-containing transcription factor, was investigated in vivo by generating the deltaEF1 mutant mice. The mutated allele of deltaEF1 produced a truncated form of the deltaEF1 protein lacking a zinc finger cluster proximal to COOH terminus. The homozygous deltaEF1 mutant mice had poorly developed thymi with no distinction of cortex and medulla. Analysis of the mutant thymocyte showed reduction of the total cell number by two orders of magnitude accompanying the impaired thymocyte development. The early stage intrathymic c-kit+ T precursor cells were largely depleted. The following thymocyte development also seemed to be affected as assessed by the distorted composition of CD4- or CD8-expressing cells. The mutant thymocyte showed elevated alpha4 integrin expression, which might be related to the T cell defect in the mutant mice. In the peripheral lymph node tissue of the mutant mice, the CD4-CD8+ single positive cells were significantly reduced relative to CD4+CD8-single positive cells. In contrast to T cells, other hematopoietic lineages appeared to be normal. The data indicated that deltaEF1 is involved in regulation of T cell development at multiple stages.
Figures
Figure 2
ΔC-fin δEF1 mutant allele generated by homologous recombination. (A) The last three exons (–8) of the mouse δEF1 gene encoding the homeodomain and the C-proximal zinc finger cluster are shown (top) together with the targeting vector (middle) and the resulting genomic structure of the homologous recombinant (bottom). Stop codons and the neor cassette are inserted in the middle of the 6th exon, downstream of the homeodomain in the targeting vector. A DT-A cassette (11) was added at the 3′ end of the vector for negative selection against random insertion of the vector. neor, neomycin resistance gene cassette; DT-A, the Diphtheria toxin A chain expression cassette. The diagnostic BglII fragments detected in Southern blots using the probe (indicated by the thick bar) are shown. Restriction sites of SalI, ApaI, and Sau3AI in the genomic DNA used for the targeting vector construction are also shown (see Materials and Methods). (B) Proteins coded by wild-type allele (wt) and the mutated (ΔC-fin) allele are schematically shown. (C) DNAs isolated from wild-type mice (+/+), a recombinant ES clone (A84), and mice heterozygous (+/−) or homozygous (−/−) for the mutant δEF1 gene were digested with BglII and subjected to Southern blot analysis using the indicated probe. (D) Total RNAs (5 μg each) from wild-type (+/+), heterozygous (+/−), and homozygous (−/−) embryos (12.5 d.p.c.) were analyzed by Northern blotting using a mouse δEF1 cDNA (clone M12) as probe. Only the larger size mRNA (δEF1+neor) resulting from the insertion of neor was detected in a homozygous embryo, while only the normal size of δEF1 mRNA was present in a wild type, and both were in a heterozygous embryo. (E) Nuclear extracts from wild-type (+/+), heterozygous (+/−) and homozygous (−/−) 12.5 d.p.c. embryos were immunoprecipitated and analyzed by Western blotting for δEF1 and \xc6 C-fin protein using anti-δEF1 antiserum which can react to N-proximal portion of δEF1 (see Materials and Methods). As size references, the nuclear extracts from the COS cells transfected with expression vectors of wild-type (wt/COS) and ΔC-fin δEF1 protein (ΔC-fin/COS) were also electrophoresed in parallel.
Figure 1
δEF1 expression in adult lymphoid tissues. (A) Total RNAs were prepared from splenocytes (lane 1), thymocytes (lane 2), and bone marrow cells (lane 3) of 8-wk-old wild-type C57BL/6 mice. Each 5-μg RNA sample was analyzed by Northern blotting using a mouse δEF1 cDNA as probe. The position of the origin of electrophoresis, δEF1 mRNA and ribosomal RNAs are indicated. The same filter was rehybridized for glyceraldehyde- 3-phosphate dehydrogenase (G3PDH) mRNA to control the amount of loaded mRNAs. (B) A section of thymus of 18.5 d.p.c. embryo was doubly stained with anti-δEF1 antibody (green) and a mixture of anti-CD4 and anti-CD8 antibodies (orange). Note that the majority of the thymocytes had δEF1 in the nuclei, together with CD4/CD8 on cell surface. Bar, 10 μm.
Figure 3
Histology of thymus of δEF1 mutant mouse. Thymi of 6-wk-old heterozygous control (A, C) and homozygous mutant (B, D) mice were fixed in Bouin's fixative and stained with hematoxylin and eosin. The control thymus had developed distinct medulla and cortex (A), while mutant thymi had uniform parenchyma with light staining as seen in medulla of the control thymus (B). Note also the differences of size and cellularity between them. The control thymus had a typical cortex which consists of the densely packed and actively proliferating small thymocytes as shown in higher magnification (C), while the mutant thymus seemed to lack its architecture (D). Bars: (A and B) 200 μm; (C and D) 40 μm.
Figure 4
Total cell count of lymphocytes in lymphoid organs of δEF1 mutant mice in comparison with control heterozygous littermates. Total lymphocyte numbers in thymi (A), spleens (B), and lymph nodes (C) of 6–11 wk were plotted. Note severe reduction of the total lymphocyte numbers in the mutant thymi (∼100-fold) and lymph nodes (∼10-fold) while the difference in cell number was less pronounced in the spleen.
Figure 5
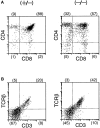
FACS® analysis of thymocytes from a δEF1 mutant and a control heterozygous littermate. Thymocytes from 6-wk-old homozygous mutant (left) and heterozygous littermate (right) were analyzed by staining with the combination of mAbs: (A) PE–anti-CD4 vs. FITC–anti-CD8; (B) PE–anti-α/βTCR vs. FITC–anti-CD3 to assess developmental stages of thymocytes. Numbers in parentheses indicate the percentage of cells within the quadrant defined by fluorescence of cell surface markers. The thymocytes were also analyzed by the forward light scattering for the estimation of cell size (C). The histograms for whole or a portion of the thymocytes that were logically gated for the DN, DP, and SP cells in A are shown with combination of heterozygous (+/−) and mutant (−/−) thymocyte data: abscissa, forward light scattering and ordinate, relative cell number.
Figure 6
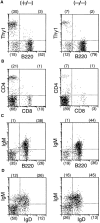
FACS® analysis of splenocytes from a δEF1 mutant and a control heterozygous littermate. Splenocytes from 6-wk-old homozygous mutant (left) and heterozygous littermate (right) were doubly stained with the following combinations of mAbs; (A) PE–anti-Thy1 vs. FITC–anti-B220 to assess fractions of T and B cells; (B) PE–anti-CD4 vs. FITC–anti-CD8 to assess CD4, CD8 expression in T cell population; (C) biotinylated antiIgM plus streptoavidin-PE vs. FITC–anti-B220 and; (D) biotinylated anti-IgM plus streptoavidin-PE vs FITC–anti-IgD to assess development of B cells. Numbers in parentheses have the same indication as in Fig. 5.
Figure 7
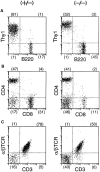
FACS® analysis of lymph node lymphocytes from a δEF1 mutant and a control heterozygous littermate. Inguinal lymph node cells from 6-wk-old homozygous mutant (left) and heterozygous littermate (right) were doubly stained with the following combinations of mAbs; (A) PE– anti-Thy1 vs. FITC–anti-B220; (B) PE–anti-CD4 vs. FITC–anti-CD8; (C) PE–anti-α/βTCR vs. FITC–anti-CD3. Numbers in parentheses have the same indication as Fig. 5.
Figure 8
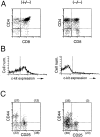
FACS® analysis of c-kit, CD25 and CD44 expression in CD4−CD8− cell population in thymocytes of a δEF1 mutant and a control heterozygous littermate. For analysis of the c-kit expression, thymocytes from a δEF1 mutant and heterozygous littermate of 6-wk-old were subjected to the three-color analysis by staining with FITC–anti-CD8 and PE–anti-CD4 mAbs, and with biotin conjugated anti–c-kit receptor mAb plus Cy-chrome streptoavidin. CD4 and CD8 expression were analyzed in whole thymocytes (–). Histograms of c-kit receptor expression in DN fraction (boxed in A) are shown below (B). CD44 and CD25 expression were also analyzed in CD4−CD8− cell populations (C). Each histogram in B was drawn so that the total number of cells sampled was equal between the mutant and heterozygous littermate. Abscissa indicates intensity of Cy-chrome fluorescence, and ordinate represents relative cell number. For analysis of the CD44 and CD25 expression, thymocytes were stained with FITC–anti-CD25 and PE–anti-CD44 mAb, and with a mixture of biotin conjugated anti-CD4 and CD8 mAbs plus Cy-chrome streptoavidin. Numbers in parentheses have the same indication as Fig. 5.
Figure 9
FACS® analysis of α4 integrin expression in thymocytes of a δEF1 mutant and a control heterozygous littermate. Thymocytes from a δEF1 mutant (B) and a heterozygous littermate (A) were stained with FITC–anti-CD3 mAb, PE–anti-α/βTCR mAb and biotin-conjugated anti-α4 integrin mAb plus Cy-chrome streptoavidin, and analyzed for α4 integrin expression in α/βTCR2/lowCD32/low and α/βTCRhigh CD3 high populations marked by 1 and 2, respectively. Histograms of the α4 integrin expression of mutant (−/−) and heterozygous littermate (+/−) thymocytes were compared in C and D for populations 1 and 2, respectively. Each histogram was drawn so that the total number of cells sampled in each cell population was equal between the mutant and heterozygous littermate. Abscissa indicates intensity of Cy-chrome fluorescence, and ordinate represents relative cell number.
Similar articles
- DeltaEF1, a zinc finger and homeodomain transcription factor, is required for skeleton patterning in multiple lineages.
Takagi T, Moribe H, Kondoh H, Higashi Y. Takagi T, et al. Development. 1998 Jan;125(1):21-31. doi: 10.1242/dev.125.1.21. Development. 1998. PMID: 9389660 - An HMG-box-containing T-cell factor required for thymocyte differentiation.
Verbeek S, Izon D, Hofhuis F, Robanus-Maandag E, te Riele H, van de Wetering M, Oosterwegel M, Wilson A, MacDonald HR, Clevers H. Verbeek S, et al. Nature. 1995 Mar 2;374(6517):70-4. doi: 10.1038/374070a0. Nature. 1995. PMID: 7870176 - New mode of DNA binding of multi-zinc finger transcription factors: deltaEF1 family members bind with two hands to two target sites.
Remacle JE, Kraft H, Lerchner W, Wuytens G, Collart C, Verschueren K, Smith JC, Huylebroeck D. Remacle JE, et al. EMBO J. 1999 Sep 15;18(18):5073-84. doi: 10.1093/emboj/18.18.5073. EMBO J. 1999. PMID: 10487759 Free PMC article. - Orphan nuclear receptors in T lymphocyte development.
He YW. He YW. J Leukoc Biol. 2002 Sep;72(3):440-6. J Leukoc Biol. 2002. PMID: 12223510 Review. - SIP1 (Smad interacting protein 1) and deltaEF1 (delta-crystallin enhancer binding factor) are structurally similar transcriptional repressors.
van Grunsven LA, Schellens A, Huylebroeck D, Verschueren K. van Grunsven LA, et al. J Bone Joint Surg Am. 2001;83-A Suppl 1(Pt 1):S40-7. J Bone Joint Surg Am. 2001. PMID: 11263664 Review.
Cited by
- A Closer Look into White Adipose Tissue Biology and the Molecular Regulation of Stem Cell Commitment and Differentiation.
Dowker-Key PD, Jadi PK, Gill NB, Hubbard KN, Elshaarrawi A, Alfatlawy ND, Bettaieb A. Dowker-Key PD, et al. Genes (Basel). 2024 Aug 2;15(8):1017. doi: 10.3390/genes15081017. Genes (Basel). 2024. PMID: 39202377 Free PMC article. Review. - Corneal injury repair and the potential involvement of ZEB1.
Jin L, Zhang L, Yan C, Liu M, Dean DC, Liu Y. Jin L, et al. Eye Vis (Lond). 2024 Jun 1;11(1):20. doi: 10.1186/s40662-024-00387-0. Eye Vis (Lond). 2024. PMID: 38822380 Free PMC article. Review. - Conditional deletion of Zeb1 in Csf1r+ cells reduces inflammatory response of the cornea to alkali burn.
Do KK, Wang F, Sun X, Zhang Y, Liang W, Liu JY, Jiang DY, Lu X, Wang W, Zhang L, Dean DC, Liu Y. Do KK, et al. iScience. 2024 Apr 9;27(5):109694. doi: 10.1016/j.isci.2024.109694. eCollection 2024 May 17. iScience. 2024. PMID: 38660397 Free PMC article. - Zeb1 Regulates the Function of Lympho-Myeloid Primed Progenitors after Transplantation.
Almotiri A, Boyd AS, Rodrigues NP. Almotiri A, et al. Biomolecules. 2023 Sep 14;13(9):1386. doi: 10.3390/biom13091386. Biomolecules. 2023. PMID: 37759786 Free PMC article. - ZEB1 promotes non-homologous end joining double-strand break repair.
Genetta TL, Hurwitz JC, Clark EA, Herold BT, Khalil S, Abbas T, Larner JM. Genetta TL, et al. Nucleic Acids Res. 2023 Oct 13;51(18):9863-9879. doi: 10.1093/nar/gkad723. Nucleic Acids Res. 2023. PMID: 37665026 Free PMC article.
References
- Robey E, Fowlkes BJ. Selective events in T cell development. Ann Rev Immunol. 1994;12:675–705. - PubMed
- Pfeffer K, Mak TW. Lymphocyte ontogeny and activation in gene targeted mutant mice. Ann Rev Immunol. 1994;12:367–411. - PubMed
- Funahashi J-I, Sekido R, Murai K, Kamachi Y, Kondoh H. δ-crystallin enhancer binding protein δEF1 is a zinc finger homeodomain protein implicated in postgastrulation embryogenesis. Development. 1993;119:433–446. - PubMed
Publication types
MeSH terms
Substances
LinkOut - more resources
Full Text Sources
Other Literature Sources
Molecular Biology Databases
Research Materials


