Proliferation in the rat olfactory epithelium: age-dependent changes - PubMed (original) (raw)
Proliferation in the rat olfactory epithelium: age-dependent changes
E Weiler et al. J Neurosci. 1997.
Abstract
Vertebrate olfactory sensory neurons are replaced continuously throughout life. We studied the effect of age on proliferation in olfactory epithelium in postnatal rats ranging in age from birth (P1) until P333. Using BrdU to label dividing cells, we determined the proliferation density of basal cells, i.e., the number of labeled nuclei/unit length (240 microm) of olfactory epithelium in coronal sections from six different anterior-posterior levels from each animal. A total length of >1 m of olfactory epithelium was counted in each age group. We observed a dramatic decrease of proliferation density from P1 through P333. At P1, proliferation density is 151 cells/mm; it decreases to approximately half at P21 (70 cells/mm), and half again at P40 (37 cells/mm). At P333 the proliferation density was only 8/mm, approximately 5% of that seen at P1. The changes were clearly related to age and not to body weight, because the values were essentially identical for males and females of the same age but of different body weight. Proliferating cells appear in patches that, after P40, become more separated from one another and contain fewer cells. In 6- and 11-month-old rats, 30 and 45% of all units contained no labeled cells. We confirmed the data of others that the olfactory surface area continuously increases with age; we showed that there is a reciprocal relationship between proliferation density and surface area. The proliferating cells provide neurons to sustain growth as well as to replace dying cells.
Figures
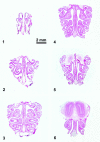
Fig. 1.
Coronal sections from the rat nose at different anterior–posterior levels. These six regions, defined by the pattern of the turbinates were used in the present study.
Fig. 2.
Postnatal changes in the mean value of the body weight from male and female Sprague Dawley rats. Body weight increase continues with age (during the period studied) in males as well as in females. The females show a significantly slower increase after P25 compared with males.
Fig. 8.
Typical distribution profiles of the extent of olfactory epithelium from anterior to posterior at different ages. Each_point_ represents the length of olfactory epithelium on the right side measured in a frontal section at the respective level of the anterior–posterior axis. Zero represents the most rostral beginning of the olfactory epithelium. The area_under_ each of these curves represents the area of the right olfactory sensory sheet in the respective animal. The area increases continuously during postnatal development. For clarity, the P1 and P105 curves are not shown, but the area values are given.
Fig. 3.
Proliferation density in the olfactory epithelium measured as the number of BrdU-labeled basal cells per millimeter. Each_symbol_ represents the average value of one animal. In some age groups, the values are so close that they cannot be distinguished as separate symbols. For detail (animal numbers), see Table 1. The values for males and females at the same age are not different from one another.
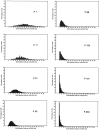
Fig. 4.
Distribution pattern of the proliferation density. In young animals, more units (240 μm) have a high number of labeled cells, whereas in older animals most units have only a few or no labeled cells.
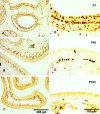
Fig. 5.
BrdU-labeled cells in the olfactory epithelium of animals at P1 (A, D), P40 (B, E), and P333 (C, F). The frequency of the labeled cells decreases dramatically with age. Whereas in newborns, the basal cells are so close together that they span nearly two rows (D), in P40 animals they form one line and/or are arranged in clusters (E). In P333 animals the clusters contain fewer cells and there are long spaces between clusters (F). The 400 μm marker in C also applies to A and B, and the 100 μm marker in F also applies to D and_E_.
Fig. 6.
Proliferation density in the different regions ranging from anterior to posterior. There are no differences in the mean values among the regions (except region 1, see text). This is true for all age groups. Animals younger than P21 are not shown, because at those ages the regions are not exactly the same as in the other groups owing to the allometric growth of the turbinates. The SE values are omitted for clarity, but are included in Table 2.
Fig. 7.
Proliferation density differences between the right and left sides of the olfactory epithelium in individual animals with the right side set at 100%. There is no trend or significant difference within any of the age groups.
Fig. 15.
This graph shows the increase of the area of the olfactory sheet in postnatal development superimposed on the proliferation density (see Fig. 3). Area and proliferation density change reciprocally.
Fig. 9.
The epithelial thickness changes postnatally. There is an increase in thickness until P40, followed by a continuous decrease. Mean values and SD values are given for the different age groups.
Fig. 10.
Number of nuclear profiles of neurons in a length of 200 μm olfactory epithelium at different thicknesses of the epithelium in P21 animals. There is a strong linear correlation between the number of neurons and the thickness of the epithelium. The number of cell nuclei increases with epithelial thickness. Each_point_ represents the number of nuclei, the profiles for which lie within the 10 μm section, between the supporting cells and the basal cells.
Fig. 11.
Number of nuclear profiles of neurons at different ages in a 200 μm length of olfactory epithelium and with a given thickness of 60 μm. The numbers were calculated for this thickness from the linear regression curves from the values in each age group. There is an increase in cell density from birth to P21 and then a decrease. The density stays nearly constant from P105.
Fig. 12.
Number of neuronal profiles per millimeter length for the average thickness for each age group. The values in this graph were calculated from the linear regression curves for each age group. The number of neurons per millimeter length of the olfactory epithelium increases at P21 and then decreases almost continuously. This means that the total number of neurons in a given area would decline. The number of basal cells declines continuously from P1.
Fig. 13.
Percentage of BrdU-labeled cells in the basal cell compartment [number of BrdU-labeled cells divided by total number of basal cells (▪)]. The lower curve(×) represents the calculated percentages of BrdU-labeled cells of the total number of neurons plus basal cells.
Fig. 14.
The ratio of the number of neurons to the number of BrdU-labeled basal cells changes significantly with age, from 6:1 in the neonate to 93:1 at P181 and P333.
Similar articles
- Supporting cell proliferation in the olfactory epithelium decreases postnatally.
Weiler E, Farbman AI. Weiler E, et al. Glia. 1998 Apr;22(4):315-28. doi: 10.1002/(sici)1098-1136(199804)22:4<315::aid-glia1>3.0.co;2-2. Glia. 1998. PMID: 9517564 - Proliferation in the vomeronasal organ of the rat during postnatal development.
Weiler E, McCulloch MA, Farbman AI. Weiler E, et al. Eur J Neurosci. 1999 Feb;11(2):700-11. doi: 10.1046/j.1460-9568.1999.00476.x. Eur J Neurosci. 1999. PMID: 10051771 - Mitral cell loss following lateral olfactory tract transection increases proliferation density in rat olfactory epithelium.
Weiler E, Farbman AI. Weiler E, et al. Eur J Neurosci. 1999 Sep;11(9):3265-75. doi: 10.1046/j.1460-9568.1999.00748.x. Eur J Neurosci. 1999. PMID: 10510190 - Continuous neurogenesis in the olfactory brain of adult shore crabs, Carcinus maenas.
Schmidt M. Schmidt M. Brain Res. 1997 Jul 11;762(1-2):131-43. doi: 10.1016/s0006-8993(97)00376-4. Brain Res. 1997. PMID: 9262167 - Identification and molecular regulation of neural stem cells in the olfactory epithelium.
Beites CL, Kawauchi S, Crocker CE, Calof AL. Beites CL, et al. Exp Cell Res. 2005 Jun 10;306(2):309-16. doi: 10.1016/j.yexcr.2005.03.027. Epub 2005 Apr 21. Exp Cell Res. 2005. PMID: 15925585 Review.
Cited by
- The role of a ciliary GTPase in the regulation of neuronal maturation of olfactory sensory neurons.
Habif JC, Xie C, de Celis C, Ukhanov K, Green WW, Moretta JC, Zhang L, Campbell RJ, Martens JR. Habif JC, et al. Development. 2023 Jan 15;150(2):dev201116. doi: 10.1242/dev.201116. Epub 2023 Jan 19. Development. 2023. PMID: 36661357 Free PMC article. - Lifespan of mature olfactory sensory neurons varies with location in the mouse olfactory epithelium and age of the animal.
Gaun V, Martens JR, Schwob JE. Gaun V, et al. J Comp Neurol. 2022 Aug;530(12):2238-2251. doi: 10.1002/cne.25330. Epub 2022 Apr 17. J Comp Neurol. 2022. PMID: 35434783 Free PMC article. - Endogenous pH 6.0 β-Galactosidase Activity Is Linked to Neuronal Differentiation in the Olfactory Epithelium.
de Mera-Rodríguez JA, Álvarez-Hernán G, Gañán Y, Santos-Almeida A, Martín-Partido G, Rodríguez-León J, Francisco-Morcillo J. de Mera-Rodríguez JA, et al. Cells. 2022 Jan 16;11(2):298. doi: 10.3390/cells11020298. Cells. 2022. PMID: 35053414 Free PMC article. - A comparison of diceCT and histology for determination of nasal epithelial type.
Smith TD, Corbin HM, King SEE, Bhatnagar KP, DeLeon VB. Smith TD, et al. PeerJ. 2021 Nov 3;9:e12261. doi: 10.7717/peerj.12261. eCollection 2021. PeerJ. 2021. PMID: 34760352 Free PMC article. - Diving into the streams and waves of constitutive and regenerative olfactory neurogenesis: insights from zebrafish.
Calvo-Ochoa E, Byrd-Jacobs CA, Fuss SH. Calvo-Ochoa E, et al. Cell Tissue Res. 2021 Jan;383(1):227-253. doi: 10.1007/s00441-020-03334-2. Epub 2020 Nov 27. Cell Tissue Res. 2021. PMID: 33245413 Review.
References
- Abercrombie M. Estimation of nuclear population from microtome sections. Anat Rec. 1946;94:239–247. - PubMed
- Allison AC, Warwick RTT. Quantitative observation on the olfactory system of the rabbit. Brain. 1949;72:186–197. - PubMed
- Altman J. Autoradiographic and histological studies of postnatal neurogenesis. IV. Cell proliferation and migration in the anterior forebrain, with special reference to persisting, neurogenesis in the olfactory bulb. J Comp Neurol. 1969;137:433–458. - PubMed
- Alvarez-Buylla A, Lois C. Neuronal stem cells in the brain of adult vertebrates. Stem Cells. 1995;13:263–272. - PubMed
- Apfelbach R, Russ D, Slotnick BM. Ontogenetic changes in odor sensitivity, olfactory receptor area and olfactory receptor density in the rat. Chem Senses. 1991;16:209–218.
Publication types
MeSH terms
Substances
LinkOut - more resources
Full Text Sources
Medical


