Amyloid-beta peptide-receptor for advanced glycation endproduct interaction elicits neuronal expression of macrophage-colony stimulating factor: a proinflammatory pathway in Alzheimer disease - PubMed (original) (raw)
Comparative Study
Amyloid-beta peptide-receptor for advanced glycation endproduct interaction elicits neuronal expression of macrophage-colony stimulating factor: a proinflammatory pathway in Alzheimer disease
S Du Yan et al. Proc Natl Acad Sci U S A. 1997.
Abstract
In Alzheimer disease (AD), neurons are thought to be subjected to the deleterious cytotoxic effects of activated microglia. We demonstrate that binding of amyloid-beta peptide (Abeta) to neuronal Receptor for Advanced Glycation Endproduct (RAGE), a cell surface receptor for Abeta, induces macrophage-colony stimulating factor (M-CSF) by an oxidant sensitive, nuclear factor kappaB-dependent pathway. AD brain shows increased neuronal expression of M-CSF in proximity to Abeta deposits, and in cerebrospinal fluid from AD patients there was approximately 5-fold increased M-CSF antigen (P < 0.01), compared with age-matched controls. M-CSF released by Abeta-stimulated neurons interacts with its cognate receptor, c-fms, on microglia, thereby triggering chemotaxis, cell proliferation, increased expression of the macrophage scavenger receptor and apolipoprotein E, and enhanced survival of microglia exposed to Abeta, consistent with pathologic findings in AD. These data delineate an inflammatory pathway triggered by engagement of Abeta on neuronal RAGE. We suggest that M-CSF, thus generated, contributes to the pathogenesis of AD, and that M-CSF in cerebrospinal fluid might provide a means for monitoring neuronal perturbation at an early stage in AD.
Figures
Figure 1
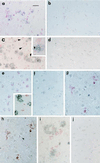
Expression of markers of oxidant stress (H0–1, a and b; p50, c and d), M-CSF (e and f), and VCAM-1 (i and j) in neurons proximate to Aβ, and expression of c-fms (g) in microglial in AD brain. a and c demonstrate increased expression of H0–1 and p50, respectively, in neurons of temporal lobe from AD brain, and b and d show weak staining for the same antigens in age-matched controls. The arrows and inset in c show nuclear localization of p50 in certain neurons. e and i display increased neuronal staining for M-CSF and VCAM-1 in AD brain, respectively, versus low levels of these antigens in age-matched controls (f and j, respectively). The inset in e shows location of M-CSF and plaques in double-stained AD brain (red is M-CSF; black is Aβ). g and h shows double immunostaining of the same section and depicts increased expression of c-fms in microglia in AD brain (g), identified by staining for CD68 (h); there is no staining for this antigen in age-matched controls (data not shown). These results are representative of immunohistologic analyses of five AD and four age-matched control brains (postmortem time of 2–6 hr). [Bar = 56 μm (a–f, j) and 12 nm (g–i).]
Figure 2
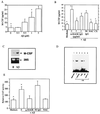
Expression of M-CSF by human neuroblastoma cells exposed to Aβ. (A) Neuroblastoma cells (2 × 10⁶ cells per well; SK-N-SH) in Opti-MEM (GIBCO) were incubated for 8 hr at 37°C with Aβ 1–40 at the indicated concentration, and supernatants were centrifuged and assayed for M-CSF antigen. (B) Neuroblastoma cells were incubated with Aβ (1–40; 1 μM) for 8 hr at 37°C alone or in the presence of α-RAGE IgG (5 μg/ml), nonimmune (NI) IgG (5 μg/ml), NAC (20 mM), or cycloheximide (CX; 50 μg/ml). Cultures were preincubated with antibodies or NAC for 1 hr. Results with cultures exposed to medium alone are designated “medium.” ELISA was performed on cell-free supernatants as in A. (C) Northern blot analysis was performed on samples from neuroblastoma cells (5 × 10⁶) incubated with medium alone (0) or medium with Aβ (1–40; 1 μM) for 6 hr at 37°C using 32P-labeled cDNA for M-CSF (Upper). (Lower) Ethidium bromide staining of the same gel reveals approximately equal intensity of the 28S band. (D) Electrophoretic mobility-shift assay was performed on nuclear extracts harvested from neuroblastoma cells (2 × 10⁷) incubated for 6 hr at 37°C in Opti-MEM (medium alone; lane 1) or medium supplemented with Aβ (1–40; 1 μM) alone (lane 2) or Aβ + α-RAGE IgG (10 μg/ml; lane 3), nonimmune IgG (10 μg/ml; NI; lane 4) or NAC (20 mM; lane 5). As indicated, an 100-fold molar excess of unlabeled NF-κB oligonucleotide was added (lane 6). (E) Liposome-mediated transient transfection of neuroblastoma cells (1.6 × 10⁶) was performed using a promoter-reporter gene construct comprising the wild-type NF-κB sites from the M-CSF promoter. Where indicated, Aβ (1 μM), α-RAGE IgG (10 μg/ml), nonimmune IgG (10 μg/ml; NI), or NAC (20 mM) were also present (preincubation with these agents was performed as above). “Medium” indicates cultures subjected to transient transfection as above, but incubated in medium alone. Cotransfection was performed with pSV-β-galactosidase and results are reported as relative CAT activity. ∗, P < 0.05 compared with controls incubated with medium alone.
Figure 3
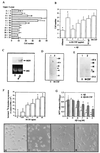
M-CSF induces activation of BV-2 cells and enhances their survival in the presence of toxic levels of Aβ. (A) Chemotaxis of BV-2 cells was studied using microchemotaxis chambers: 1 × 10⁴ cells were added to the upper compartment and M-CSF (ng/ml) was added to the upper and/or lower compartment as indicated. After 1.5 hr at 37°C, cells reaching the lower surface of the chemotaxis chamber membrane were visualized with Wright’s stain and counted. Data are reported as cells per high-power field (HPF) based on counting nine fields per well. (B) Neuroblastoma cells (2 × 10⁶) were incubated with Aβ (1–40; 1 μM) or albumin (1 μM) immobilized on Amino Link Coupling gel for 8 hr at 37°C. Beads were removed by centrifugation, and the supernatant was used to perform chemotaxis assays as indicated in A (above). Where indicated, anti-M-CSF IgG (α-M-CSF; at the indicated concentration) or nonimmune IgG (5 μg/ml) was added. (C) BV-2 cells (3 × 10⁶) were exposed to medium alone (0) or medium containing M-CSF (50 ng/ml; M-CSF) for 72 hr at 37°C in Opti-MEM, and samples were harvested for Northern blot analysis using 32P-labeled cDNA probe for murine MSR. The lower panel shows ethidium bromide staining of the same gel, and demonstrates approximately equal loading of RNA. (D) BV-2 cells (3 × 10⁶ cells) were exposed to medium alone (0) or medium containing M-CSF (50 ng/ml) for 72 hr at 37°C, and samples were obtained for Western blot analysis (the latter utilized α-MSR IgG, as described in the text). Migration of simultaneously run molecular mass standards is shown on the side of the gel in kDa. (E) BV-2 cells were exposed to medium alone (0) or medium containing M-CSF (25 ng/ml), and cell lysates were prepared for reduced SDS/PAGE followed by immunoblotting using antibody to mouse apoE. The arrowhead indicates migration of the immunoreactive band in D and E). (F) BV-2 cells (5 × 10⁴ per well) were incubated in medium alone (0) or medium supplemented with M-CSF (the indicated concentration), and [3H]thymidine incorporation was determined. (G) BV-2 cells (as above) were incubated in medium alone (0) or medium supplemented with MCSF (50 ng/ml) and were exposed to Aβ (–35) at the indicated concentrations for 24 hr. 3-(4,5-Dimethylthiazole-2-yl)-2,5-diphenyl tetrazolium bromide (MTT) reduction was determined 4 hr later. ∗, P < 0.01 or #, P < 0.05 compared with controls. (H–I) Photomicrographs of BV-2 cells incubated in medium alone (H), medium + Aβ (1–42; 2.5 μM) (I), medium + Aβ (1–42; 2.5 μM) + M-CSF (50 ng/ml) (J), or medium + M-CSF (50 ng/ml) (K) after 24 hr. (Bar = 200 μM.)
Figure 4
Exposure of human neuroblastoma cells to Aβ induces expression of VCAM-1 (A, B, and D) and is associated with activation of NF-κB (C). (A) Neuroblastoma cells were incubated with Aβ, as described for Fig. 2 A and B, and expression of VCAM-1 antigen in cell lysates was evaluated by ELISA (55). (B) Neuroblastoma cells were incubated with Aβ (–40) alone (0) or in the presence of anti-RAGE IgG (α-RAGE), nonimmune (NI) IgG or NAC as in Fig. 2, and then ELISA for VCAM-1 was performed. “Medium” denotes cultures exposed only to medium (i.e., no other additions). ∗, P < 0.05. (C) Neuroblastoma cells (2 × 10⁷ per lane) were incubated with Aβ (1 μM) and nuclear extracts were prepared and incubated with 32P-labeled oligonucleotide from the VCAM-1 promoter for gel shift assay. The same procedure as in Fig. 2_D_ was followed except that lane 1 contains free probe in this case. (D) Neuroblastoma cells (107) were incubated with medium alone (0) or Aβ (1–40; 1 μM) for 6 hr at 37°C, RNA was harvested and subjected to Northern blot analysis using 32P-labeled cDNA probe for VCAM-1. (Lower) Ethidium bromide staining of gels to visualize RNA loading.
Figure 5
M-CSF in the cerebrospinal fluid of patients with AD. Cerebrospinal fluid samples from patients with the indicated disorders or age-matched controls were obtained postmortem (3–20 hr after expiration) and studied by ELISA for M-CSF. Means ± SE and statistical significance by ANOVA. #, P < 0.01.
Similar articles
- Preventing activation of receptor for advanced glycation endproducts in Alzheimer's disease.
Lue LF, Yan SD, Stern DM, Walker DG. Lue LF, et al. Curr Drug Targets CNS Neurol Disord. 2005 Jun;4(3):249-66. doi: 10.2174/1568007054038210. Curr Drug Targets CNS Neurol Disord. 2005. PMID: 15975028 Review. - Involvement of microglial receptor for advanced glycation endproducts (RAGE) in Alzheimer's disease: identification of a cellular activation mechanism.
Lue LF, Walker DG, Brachova L, Beach TG, Rogers J, Schmidt AM, Stern DM, Yan SD. Lue LF, et al. Exp Neurol. 2001 Sep;171(1):29-45. doi: 10.1006/exnr.2001.7732. Exp Neurol. 2001. PMID: 11520119 - Cellular cofactors potentiating induction of stress and cytotoxicity by amyloid beta-peptide.
Yan SD, Roher A, Chaney M, Zlokovic B, Schmidt AM, Stern D. Yan SD, et al. Biochim Biophys Acta. 2000 Jul 26;1502(1):145-57. doi: 10.1016/s0925-4439(00)00041-7. Biochim Biophys Acta. 2000. PMID: 10899440 Review. - Expression of macrophage colony-stimulating factor receptor is increased in the AbetaPP(V717F) transgenic mouse model of Alzheimer's disease.
Murphy GM Jr, Zhao F, Yang L, Cordell B. Murphy GM Jr, et al. Am J Pathol. 2000 Sep;157(3):895-904. doi: 10.1016/s0002-9440(10)64603-2. Am J Pathol. 2000. PMID: 10980129 Free PMC article. - A specific RAGE-binding peptide biopanning from phage display random peptide library that ameliorates symptoms in amyloid β peptide-mediated neuronal disorder.
Cai C, Dai X, Zhu Y, Lian M, Xiao F, Dong F, Zhang Q, Huang Y, Zheng Q. Cai C, et al. Appl Microbiol Biotechnol. 2016 Jan;100(2):825-35. doi: 10.1007/s00253-015-7001-7. Epub 2015 Oct 24. Appl Microbiol Biotechnol. 2016. PMID: 26496918
Cited by
- Receptors on Microglia.
Augusto-Oliveira M, Tremblay MÈ, Verkhratsky A. Augusto-Oliveira M, et al. Adv Neurobiol. 2024;37:83-121. doi: 10.1007/978-3-031-55529-9_6. Adv Neurobiol. 2024. PMID: 39207688 Review. - An adapted protocol to derive microglia from stem cells and its application in the study of CSF1R-related disorders.
Dorion MF, Casas D, Shlaifer I, Yaqubi M, Fleming P, Karpilovsky N, Chen CX, Nicouleau M, Piscopo VEC, MacDougall EJ, Alluli A, Goldsmith TM, Schneider A, Dorion S, Aprahamian N, MacDonald A, Thomas RA, Dudley RWR, Hall JA, Fon EA, Antel JP, Stratton JA, Durcan TM, La Piana R, Healy LM. Dorion MF, et al. Mol Neurodegener. 2024 Apr 5;19(1):31. doi: 10.1186/s13024-024-00723-x. Mol Neurodegener. 2024. PMID: 38576039 Free PMC article. - Alzheimer's genes in microglia: a risk worth investigating.
Sudwarts A, Thinakaran G. Sudwarts A, et al. Mol Neurodegener. 2023 Nov 20;18(1):90. doi: 10.1186/s13024-023-00679-4. Mol Neurodegener. 2023. PMID: 37986179 Free PMC article. Review. - Brain rhythms control microglial response and cytokine expression via NF-κB signaling.
Prichard A, Garza KM, Shridhar A, He C, Bitarafan S, Pybus A, Wang Y, Snyder E, Goodson MC, Franklin TC, Jaeger D, Wood LB, Singer AC. Prichard A, et al. Sci Adv. 2023 Aug 9;9(32):eadf5672. doi: 10.1126/sciadv.adf5672. Epub 2023 Aug 9. Sci Adv. 2023. PMID: 37556553 Free PMC article. - A systematic review and meta-analysis of the relationship between advanced glycation end products ceceptor (RAGE) gene polymorphisms and the risk of inflammatory bowel disease.
Febrinasari RP, Indah SP, Bastomy ER, Irving S, Azmiardi A, Pribadi RR, Simadibrata M, Sari Y. Febrinasari RP, et al. Caspian J Intern Med. 2023 Summer;14(3):412-424. doi: 10.22088/cjim.14.3.41. Caspian J Intern Med. 2023. PMID: 37520885 Free PMC article. Review.
References
- Haass C, Selkoe D. Cell. 1994;75:1039–1042. - PubMed
- Scheuner D, Eckman C, Jensen M, Song X, Citron M, et al. Nat Med. 1996;2:864–869. - PubMed
- Yankner B, Duffy L, Kirschner D. Science. 1990;250:279–282. - PubMed
Publication types
MeSH terms
Substances
Grants and funding
- R29 HL051980/HL/NHLBI NIH HHS/United States
- AG00690/AG/NIA NIH HHS/United States
- AG00602/AG/NIA NIH HHS/United States
- AG11925/AG/NIA NIH HHS/United States
- R01 HL051980/HL/NHLBI NIH HHS/United States
LinkOut - more resources
Full Text Sources
Other Literature Sources
Medical
Research Materials
Miscellaneous


