A novel inhibitory receptor (ILT3) expressed on monocytes, macrophages, and dendritic cells involved in antigen processing - PubMed (original) (raw)
Comparative Study
A novel inhibitory receptor (ILT3) expressed on monocytes, macrophages, and dendritic cells involved in antigen processing
M Cella et al. J Exp Med. 1997.
Abstract
Immunoglobulin-like transcript (ILT) 3 is a novel cell surface molecule of the immunoglobulin superfamily, which is selectively expressed by myeloid antigen presenting cells (APCs) such as monocytes, macrophages, and dendritic cells. The cytoplasmic region of ILT3 contains putative immunoreceptor tyrosine-based inhibitory motifs that suggest an inhibitory function of ILT3. Indeed, co-ligation of ILT3 to stimulatory receptors expressed by APCs results in a dramatic blunting of the increased [Ca2+]i and tyrosine phosphorylation triggered by these receptors. Signal extinction involves SH2-containing protein tyrosine phosphatase 1, which is recruited by ILT3 upon cross-linking. ILT3 can also function in antigen capture and presentation. It is efficiently internalized upon cross-linking, and delivers its ligand to an intracellular compartment where it is processed and presented to T cells. Thus, ILT3 is a novel inhibitory receptor that can negatively regulate activation of APCs and can be used by APCs for antigen uptake.
Figures
Figure 1
Amino acid sequence of human ILT3, aligned with ILT1 and ILT2. Since ILT1 and ILT2 consist of four Ig-SF domains, only the two domains with higher homology to ILT3 were included in the alignment. The alignment was generated by the Clustal method. Gaps (dashes) were introduced to maximize homologies. Amino acids identical to the consensus are indicated by dots. Conserved cysteines involved in disulfide bonds in the extracellular domains are identified by asterisks. Cytoplasmic tyrosine-based motifs potentially involved in signal transduction and/or endocytosis are boxed. ILT3 has no N-linked glycosylation sites (N-X-S/T). Amino acid residues are numbered on the right side, beginning with the first residue of each of the predicted domains. ss, signal sequence; Ig1–4, Ig-SF extracellular domains; cp, connecting peptide; tm, transmembrane domain; cy, cytoplasmic domain. ILT3 cDNA sequence is available from EMBL/GenBank/DDBJ under accession number U82979.
Figure 2
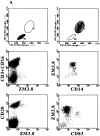
Expression of ILT3 in monocytes, primary DCs, monocyte-derived DCs, and macrophages. (A) mAb ZM3.8 stains CD14+ monocytes in PBMC and CD83+ DCs in a monocyte-enriched population (right). On the contrary, CD3+ T cells, CD16+ NK cells, or CD20+ B cells are not stained (left). PBMCs and monocyte-enriched populations were subjected to two-color staining. Lymphocytes (left) and monocytes (right) were gated using forward and side scatter (FSC and SSC) parameters. (B) ILT3 is expressed on CD14+ monocytes and on a subset of CD14-/HLA-DRhigh cells, which corresponds to circulating primary DCs (46). Monocytes were enriched from peripheral blood and subjected to three-color staining using anti-CD14 (FITC), ZM3.8 (PE), and anti-HLA-DR (APC). (C) Monocyte-derived DCs express both CD1a and ILT3. (D) Macrophages express low levels of both CD16 and ILT3. DCs and macrophages were derived from monocytes under appropriate culture conditions and subjected to two-color staining. Negative controls were located in the lower left quadrants.
Figure 3
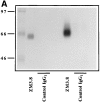
(A) SDS-PAGE analysis of ILT3 immunoprecipitated from 125I-labeled, ILT3-transfected Jurkat T cells and monocytes. ILT3 appears as a ∼55-kD band in ILT3-transfected cells and as a ∼58–60-kD band in monocytes. (B) When ILT3 is precipitated from 32P-labeled cells, it is detectable as a constitutively phosphorylated molecule.
Figure 4
Intracellular Ca2+ mobilization induced in monocytes and macrophages via CD11b (A), HLA-DR (B), and FcγRIII (C) are inhibited upon cross-linking with ILT3 (D–F). G shows that in the absence of a cross-linking antibody, ILT3 does not inhibit Ca2+ flux triggered by the 3.8B1 anti-HLA-DR mAb.
Figure 5
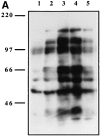
(A) Protein tyrosine phosphorylation stimulated by treatment of monocytes with the anti-HLA-DR mAb 3.8B1 is inhibited by co-ligation of HLADR with ILT3. Monocytes were incubated with medium alone (lane 1), with ZM3.8 mAb (antiILT3; lane 2), with 3.8B1 mAb (anti-HLA-DR; lane 3) or with both mAbs in the absence (lane 4) or in the presence (lane 5) of a secondary cross-linking antibody. Cell lysates were separated on SDS-PAGE, transferred to nitrocellulose, and probed with HRP-coupled antiphosphotyrosine mAb 4G10. (B) Association of SHP-1 with ILT3 is increased upon ILT3 cross-linking. Monocytes were stimulated with ZM3.8 (lane 2) or with a control IgG (5.133 mAb) (lane 1) coated on plastic plates. Cells were kept at 37°C for 2 min, harvested, and lysed. ILT3 was immunoprecipitated with ZM3.8. Proteins were separated on SDSPAGE, transferred to nitrocellulose, and probed with anti-SHP-1, followed by HRP-conjugated goat anti–rabbit Ig. The migration of SHP-1 is marked by the arrow.
Figure 6
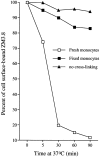
ZM3.8 mAb is internalized upon cross-linking. ZM3.8 bound to monocytes on ice did not disappear from the cell surface when the cells were shifted at 37°C, in the absence of a cross-linking antibody (▴). After cross-linking with a F(ab′)2 biotin-labeled secondary antibody, ZM3.8 was rapidly internalized, becoming undetectable by FACS® analysis in 30–60 min (□). In fixed cells, only a minimal decrease of the median fluorescence intensity was detected over time (▪). Cell surface– bound ZM3.8 was revealed by PE-conjugated goat anti–mouse IgG1 (▴) or by PE-conjugated streptavidin (□, ▪). The MFI was determined by FACS® analysis. The percentage decrease of MFI as compared to a control sample kept at 4°C was used as a measure of internalization.
Figure 7
Presentation of ZM3.8 mAb to a T cell clone specific for mouse IgG1 by irradiated monocytes. ZM3.8 mAb (▪) is presented 50– 100-fold more efficiently than anti-FcγRI (□) and 400–500-fold more efficiently than anti-TNP (•) and anti-NKAT4 KIR (○) mAbs, which do not stain monocytes.
Similar articles
- FDF03, a novel inhibitory receptor of the immunoglobulin superfamily, is expressed by human dendritic and myeloid cells.
Fournier N, Chalus L, Durand I, Garcia E, Pin JJ, Churakova T, Patel S, Zlot C, Gorman D, Zurawski S, Abrams J, Bates EE, Garrone P. Fournier N, et al. J Immunol. 2000 Aug 1;165(3):1197-209. doi: 10.4049/jimmunol.165.3.1197. J Immunol. 2000. PMID: 10903717 - A common inhibitory receptor for major histocompatibility complex class I molecules on human lymphoid and myelomonocytic cells.
Colonna M, Navarro F, Bellón T, Llano M, García P, Samaridis J, Angman L, Cella M, López-Botet M. Colonna M, et al. J Exp Med. 1997 Dec 1;186(11):1809-18. doi: 10.1084/jem.186.11.1809. J Exp Med. 1997. PMID: 9382880 Free PMC article. - A novel family of Ig-like receptors for HLA class I molecules that modulate function of lymphoid and myeloid cells.
Colonna M, Nakajima H, Navarro F, López-Botet M. Colonna M, et al. J Leukoc Biol. 1999 Sep;66(3):375-81. doi: 10.1002/jlb.66.3.375. J Leukoc Biol. 1999. PMID: 10496306 Review. - Membrane and soluble ILT3 are critical to the generation of T suppressor cells and induction of immunological tolerance.
Vlad G, Chang CC, Colovai AI, Vasilescu ER, Cortesini R, Suciu-Foca N. Vlad G, et al. Int Rev Immunol. 2010 Apr;29(2):119-32. doi: 10.3109/08830180903281185. Int Rev Immunol. 2010. PMID: 20132030 Review.
Cited by
- Contribution of macrophages to fetomaternal immunological tolerance.
Parasar P, Guru N, Nayak NR. Parasar P, et al. Hum Immunol. 2021 May;82(5):325-331. doi: 10.1016/j.humimm.2021.02.013. Epub 2021 Mar 11. Hum Immunol. 2021. PMID: 33715911 Free PMC article. Review. - The nature of activatory and tolerogenic dendritic cell-derived signal II.
Bakdash G, Sittig SP, van Dijk T, Figdor CG, de Vries IJ. Bakdash G, et al. Front Immunol. 2013 Feb 28;4:53. doi: 10.3389/fimmu.2013.00053. eCollection 2013. Front Immunol. 2013. PMID: 23450201 Free PMC article. - Dendritic cell subsets in childhood and in children with cancer: relation to age and disease prognosis.
Vakkila J, Thomson AW, Vettenranta K, Sariola H, Saarinen-Pihkala UM. Vakkila J, et al. Clin Exp Immunol. 2004 Mar;135(3):455-61. doi: 10.1111/j.1365-2249.2003.02388.x. Clin Exp Immunol. 2004. PMID: 15008978 Free PMC article. - The co-expression of activating and inhibitory leukocyte immunoglobulin-like receptors in rheumatoid synovium.
Tedla N, Gibson K, McNeil HP, Cosman D, Borges L, Arm JP. Tedla N, et al. Am J Pathol. 2002 Feb;160(2):425-31. doi: 10.1016/S0002-9440(10)64861-4. Am J Pathol. 2002. PMID: 11839562 Free PMC article. - Surface expression and function of p75/AIRM-1 or CD33 in acute myeloid leukemias: engagement of CD33 induces apoptosis of leukemic cells.
Vitale C, Romagnani C, Puccetti A, Olive D, Costello R, Chiossone L, Pitto A, Bacigalupo A, Moretta L, Mingari MC. Vitale C, et al. Proc Natl Acad Sci U S A. 2001 May 8;98(10):5764-9. doi: 10.1073/pnas.091097198. Epub 2001 Apr 24. Proc Natl Acad Sci U S A. 2001. PMID: 11320212 Free PMC article.
References
- Cambier JC, Pleiman CM, Clark MR. Signal transduction by the B cell antigen receptor and its coreceptors. Annu Rev Immunol. 1994;12:457–486. - PubMed
- Weiss A, Littman DR. Signal transduction by lymphocyte antigen receptors. Cell. 1994;76:263–274. - PubMed
- Letourneur O, Kennedy IC, Brini AT, Ortaldo JR, O'Shea JJ, Kinet JP. Characterization of the family of dimers associated with Fc receptors (Fcε RI and Fcγ RIII) J Immunol. 1991;147:2652–2656. - PubMed
Publication types
MeSH terms
Substances
LinkOut - more resources
Full Text Sources
Other Literature Sources
Molecular Biology Databases
Miscellaneous


