Single-channel kinetics, inactivation, and spatial distribution of inositol trisphosphate (IP3) receptors in Xenopus oocyte nucleus - PubMed (original) (raw)
Single-channel kinetics, inactivation, and spatial distribution of inositol trisphosphate (IP3) receptors in Xenopus oocyte nucleus
D O Mak et al. J Gen Physiol. 1997 May.
Abstract
Single-channel properties of the Xenopus inositol trisphosphate receptor (IP3R) ion channel were examined by patch clamp electrophysiology of the outer nuclear membrane of isolated oocyte nuclei. With 140 mM K+ as the charge carrier (cytoplasmic [IP3] = 10 microM, free [Ca2+] = 200 nM), the IP3R exhibited four and possibly five conductance states. The conductance of the most-frequently observed state M was 113 pS around 0 mV and approximately 300 pS at 60 mV. The channel was frequently observed with high open probability (mean P(o) = 0.4 at 20 mV). Dwell time distribution analysis revealed at least two kinetic states of M with time constants tau < 5 ms and approximately 20 ms; and at least three closed states with tau approximately 1 ms, approximately 10 ms, and >1 s. Higher cytoplasmic potential increased the relative frequency and tau of the longest closed state. A novel "flicker" kinetic mode was observed, in which the channel alternated rapidly between two new conductance states: F1 and F2. The relative occupation probability of the flicker states exhibited voltage dependence described by a Boltzmann distribution corresponding to 1.33 electron charges moving across the entire electric field during F1 to F2 transitions. Channel run-down or inactivation (tau approximately 30 s) was consistently observed in the continuous presence of IP3 and the absence of change in [Ca2+]. Some (approximately 10%) channel disappearances could be reversed by an increase in voltage before irreversible inactivation. A model for voltage-dependent channel gating is proposed in which one mechanism controls channel opening in both the normal and flicker modes, whereas a separate independent mechanism generates flicker activity and voltage-reversible inactivation. Mapping of functional channels indicates that the IP3R tends to aggregate into microscopic (<1 microm) as well as macroscopic (approximately 10 microm) clusters. Ca2+-independent inactivation of IP3R and channel clustering may contribute to complex [Ca2+] signals in cells.
Figures
Figure 1
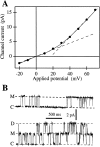
(A) I-V curve of the main state M of the IP3R in the oocyte outer nuclear membrane. Channel current amplitudes in symmetric standard solution (filled circles) were evaluated as the difference between Gaussian peaks fitted to current amplitude histograms of current records containing the closed and main states (n = 12; filtered at 1 or 5 kHz). Current amplitude in an excised patch in symmetric basic oocyte nucleus solution obtained previously (Mak and Foskett, 1994) is also plotted (solid line). The dashed lines represent differential conductances of 113 pS at 0 mV and 300 pS at 60 mV, respectively. (B) Typical current traces of the IP3R channel at 20 mV, showing closed (C), main (M), and double (D) states. Data was digitized at 2 kHz and filtered at 1 kHz.
Figure 2
Typical multiple-channel current record showing seven equally-spaced current levels at the beginning of the recording. Channel activity duration for this record is 70.2 s (from the beginning of the record to the final closing event as the last observed channel inactivated). V app was 20 mV. Data were digitized at 2 kHz and filtered digitally at 300 Hz.
Figure 3
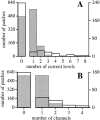
(A) Histogram analysis of current levels observed in 740 patches (unshaded histogram with thick outline). Also plotted (shaded histogram with thin outline) is the Poisson distribution with the same mean current level number per patch (0.44 current level/patch for 740 patches), calculated by assuming that each current level represents an individual IP3R that exhibited only the M state and that the channels were evenly distributed on the outer nuclear membrane. (B) Histogram analysis of number of channels in the 740 patches (unshaded histogram with thick outline) assuming that all IP3R channels observed exhibited the D state, such that every two current levels detected represents one channel. The theoretical Poisson distribution with the same mean channel number per patch (0.25 channel/patch for 740 patches) is also plotted (shaded histogram with thin outline). In both cases, the large number of observed multiple-channel patches compared with the number of observed single-channel patches suggests that the IP3R channels are not evenly distributed in the outer nuclear membrane of oocytes.
Figure 4
(A) Current trace and open probability histogram of a typical current record with the IP3R channel in the main and closed states. Base-line current level fluctuated in the record because current recording was started before the gigaseal completely stabilized. The channel in the current record inactivated permanently by 9 s after seal formation. Bin width for the histograms is 0.25 s. (B) Open probability histogram for a single IP3R with longer duration of channel activity. Bin width is 1 s. For both records V app was 20 mV, data were digitized at 2 kHz and filtered at 300 Hz digitally.
Figure 5
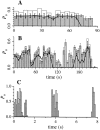
Dwell time histograms for the closed state C and open state M of the IP3R at V app = (A) 20 and (B) 40 mV, respectively. Only states C and M were observed in the single-channel current records used for this analysis. 6 records with total duration of 139.1 s were used for A, and 1 record with duration of 42.8 s was used for B. The smooth curves are theoretical probability density functions consisting of two exponentials fitted to the histograms by the maximum likelihood method (Sigworth and Sine, 1987). The time constants for the exponentials fitted are labeled in ms beside the corresponding peaks in the curves. (C) Duration histograms of inter-burst closed state and the activity bursts of an IP3R channel in the flicker mode at V app = 40 mV. The activity burst duration was defined as the interval between the departure of the channel from the closed state into either one of the flicker states (F1 or F2) and its subsequent return to the closed state for a period longer than 1 ms. Data were digitized at 2 kHz, filtered at 800 Hz and analyzed using MacTac software with channel dwell time corrected for the filtering (Colquhoun and Sigworth, 1995).
Figure 6
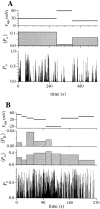
The effect of applied potential on IP3R channel open probability. 〈P o〉 is the overall open probability of the channel averaged over the interval during which the applied potential V app was constant. Bin width of the P o histogram is 0.25 s. The intervals (2– 6 s) during which the applied potential was changed in the experiment were omitted in the graphs to avoid confusion. (A) A single-channel patch in which only states C and M were observed in the entire current record up to the failure of the gigaseal at t = 615 s. (B) A patch showing two equally-spaced channel current levels. The channel(s) observed inactivated at t = 262 s. 〈P D〉 is the probability of observing the channel current in the higher level D, averaged over the interval indicated by the width of the bin. Channel current level D was not observed after t = 117.5 s. P o is the probability of the channel being open, i.e., P o = P D + P M, where P M is the probability of observing the channel current in the main state level.
Figure 7
Current traces showing rarely observed conductance states L (A) and S (B) for channels in normal kinetic mode from 2 separate experiments. Data were digitized at 2 kHz and filtered at 1 kHz. V app = 20 mV for (A) and 50 mV for (B).
Figure 8
Open probability histograms for experiments in which two evenly spaced current levels (M and D) were detected. (A and B) Histogram bin width is 5 s. Unshaded histogram bars are the measured probability of the channel current in level D (P D); shaded bars with thin error bars are the measured probability (± SEM) of the channel in state M (P M). Assuming that current level D is caused by two independent and equivalent channels contained in the same membrane patch opening to state M simultaneously, the theoretical probability P 1 of the channel current being at the level corresponding to a single channel in state M is given by the binomial distribution, The solid lines represent the theoretical probability P 1 evaluated using the measured probability P D as P 2. The thick error bars represent the errors in P 1 evaluated from the SEM of P D. In A, the measured P M agreed well with the theoretical P 1 calculated from P D, indicating that the patch probably contained two independent and equivalent channels until one channel inactivated after t = 70 s. In B, which is typical of the majority of channel current records showing two evenly spaced current levels, P M and P D measured did not obey the binomial distribution expected for two independent and equivalent channels. (C) Open probability histogram of an experiment with current level D that exhibited long quiescent periods. Histogram bin width is 0.1 s. Unshaded histogram bars represent P D; shaded bars represent P M.
Figure 9
Open probability (P o) and applied voltage (V app) graphs of an experiment showing the two different types of channel inactivation: the voltage-reverted inactivation occurring at t = 32.25 s that was reversed by the increase of V app from 20 to 60 mV at t = 60.0 s; and the irreversible inactivation occurring at t = 99.0 s. Bin width of the histogram is 0.25 s.
Figure 10
Channel activity-duration histograms of the IP3R for (A) single-channel experiments in which only one channel current level (state M) was observed (n = 24, including six inactivations after reactivation by a voltage jump); (B) multiple-channel experiments in which three or more channel current levels were observed (n = 41, including six inactivations after reactivation by a voltage jump). Note the compressed time scale of (A) after t =180 s. The measured duration of channel activity was the duration between the formation of the gigaseal (when seal resistance exceeded 200 MΩ) and the last observed channel closing event. The smooth curve in A is a single exponential functions fitted to the activity duration histogram with time constant of 21.1 ± 0.6 s. The smooth curve in B represents the theoretical functions fitted to the activity duration histogram for k = 4 with time constant of 41 ± 3 s. The theoretical fits for k = 3, 5, and 6 are very similar in shape, with different values for the time constant. Experiments in which the gigaseal broke before the channel(s) inactivated (n = 3 and 18 for A and B, respectively) were excluded from the activity duration histograms. Their duration distributions (shaded histograms) showed that failure of the gigaseal probably does not cause any significant systematic bias in the activity-duration histograms.
Figure 11
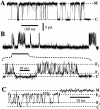
Typical current trace of an IP3R channel (A) in the normal kinetic mode (B) in the flicker kinetic mode with bursts of activities and (C) in a transition from flicker mode to the normal mode without closing. The dashed lines indicate the current levels of the various conductance states. V app was 50 mV. Data were digitized at 12.5 kHz and filtered at 5 kHz.
Figure 12
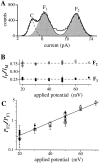
(A) Current amplitude histogram of a channel in the flicker kinetic mode. Segments of current traces during which the channel showed bursts of activities were selected to generate the histogram with bin width of 0.1 pA. V app was 50 mV. Data were digitized at 12.5 kHz and filtered at 5 kHz. Theoretical fit to the histogram (smooth curve) is the sum of three Gaussian functions representing the closed state C (dashed curve), and the flicker states F1 and F2 (shaded areas). (B) Ratios of the channel current amplitude I F1/I M and I F2/I M under various applied potentials. The current amplitudes I F1, I F2, and I M used for each data point were obtained in the same patch clamp experiment. Solid circles represent I F1/I M and open circles I F2/I M. Dashed lines indicate the mean ratios assuming no voltage dependence (0.27 for I F1/I M and 0.78 for I F2/I M). Most of the error in the ratios came from the fitting of the channel current amplitude histogram with the Gaussian functions. (C) Voltage dependence of the relative occupation probability of the flicker channel states P F2/P F1. Each type of open symbol (squares, triangles, circles, and diamonds) represents a series of data points obtained from the same single-channel patch. Filled circles are data points each from an individual patch at only one voltage. The straight line is the theoretical fit assuming that the occupation probability follows a Boltzmann distribution. The larger error in the data points for 20 mV is due to difficulty in fitting the Gaussian function to the scarce F2 state.
Figure 13
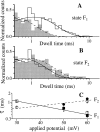
Effect of applied potential on the dwell time distributions of the flicker states F1 and F2. In A and B, V app = 30 mV for the unfilled histograms, and the solid curves are the theoretical probability density functions each with one exponential component fitted using the maximum likelihood method (Sigworth and Sine, 1987). V app = 60 mV for the shaded histograms and the dashed curves are their fitted single-exponential probability density functions. The transition counts were normalized so that the peaks of the fitted probability density functions have the same height. There are 784 and 209 transitions for 30 and 60 mV, respectively, in A; and 543 and 380 transitions for 30 and 60 mV, respectively, for B. Analysis was done on data digitized at 12.5 kHz and filtered at 2 kHz using pClamp 6.0.2. (C) is the graph of the time constants τ of the theoretical probability density functions fitted to the dwell time histograms of the flicker states under various applied potentials. Squares are time constants for F1 and circles are for F2. Open and filled symbols are from two different experiments. The lines are theoretical time constant values fitted according to the Arrhenius theory.
Figure 14
Schematic diagram of the double-gate model, showing transitions, especially voltage-dependent ones, between various kinetic states for the two gates controlling the kinetic behavior of the IP3R channel.
Similar articles
- Inositol 1,4,5-trisphosphate [correction of tris-phosphate] activation of inositol trisphosphate [correction of tris-phosphate] receptor Ca2+ channel by ligand tuning of Ca2+ inhibition.
Mak DO, McBride S, Foskett JK. Mak DO, et al. Proc Natl Acad Sci U S A. 1998 Dec 22;95(26):15821-5. doi: 10.1073/pnas.95.26.15821. Proc Natl Acad Sci U S A. 1998. PMID: 9861054 Free PMC article. - IP3 receptor purified from liver plasma membrane is an (1,4,5)IP3 activated and (1,3,4,5)IP4 inhibited calcium permeable ion channel.
Mayrleitner M, Schäfer R, Fleischer S. Mayrleitner M, et al. Cell Calcium. 1995 Feb;17(2):141-53. doi: 10.1016/0143-4160(95)90083-7. Cell Calcium. 1995. PMID: 7736563 - IP3 receptor-mediated spatial and temporal Ca2+ signaling of the cell.
Miyazaki S. Miyazaki S. Jpn J Physiol. 1993;43(4):409-34. doi: 10.2170/jjphysiol.43.409. Jpn J Physiol. 1993. PMID: 8114355 Review. - Structure and function of IP3 receptors.
Mikoshiba K, Furuichi T, Miyawaki A. Mikoshiba K, et al. Semin Cell Biol. 1994 Aug;5(4):273-81. doi: 10.1006/scel.1994.1033. Semin Cell Biol. 1994. PMID: 7994011 Review.
Cited by
- Inositol 1,4,5-trisphosphate receptors in the endoplasmic reticulum: A single-channel point of view.
Mak DO, Foskett JK. Mak DO, et al. Cell Calcium. 2015 Jul;58(1):67-78. doi: 10.1016/j.ceca.2014.12.008. Epub 2014 Dec 18. Cell Calcium. 2015. PMID: 25555684 Free PMC article. Review. - Clustering of InsP3 receptors by InsP3 retunes their regulation by InsP3 and Ca2+.
Taufiq-Ur-Rahman, Skupin A, Falcke M, Taylor CW. Taufiq-Ur-Rahman, et al. Nature. 2009 Apr 2;458(7238):655-9. doi: 10.1038/nature07763. Nature. 2009. PMID: 19348050 Free PMC article. - Differential distribution, clustering, and lateral diffusion of subtypes of the inositol 1,4,5-trisphosphate receptor.
Pantazaka E, Taylor CW. Pantazaka E, et al. J Biol Chem. 2011 Jul 1;286(26):23378-87. doi: 10.1074/jbc.M111.236372. Epub 2011 May 5. J Biol Chem. 2011. PMID: 21550988 Free PMC article. - Mode switching is the major mechanism of ligand regulation of InsP3 receptor calcium release channels.
Ionescu L, White C, Cheung KH, Shuai J, Parker I, Pearson JE, Foskett JK, Mak DO. Ionescu L, et al. J Gen Physiol. 2007 Dec;130(6):631-45. doi: 10.1085/jgp.200709859. Epub 2007 Nov 12. J Gen Physiol. 2007. PMID: 17998395 Free PMC article. - Release currents of IP(3) receptor channel clusters and concentration profiles.
Thul R, Falcke M. Thul R, et al. Biophys J. 2004 May;86(5):2660-73. doi: 10.1016/S0006-3495(04)74322-2. Biophys J. 2004. PMID: 15111387 Free PMC article.
References
- Ahern, G.P., P.R. Junankar, and A.F. Dulhunty. Single channel activity of the ryanodine receptor calcium release channel is modulated by FK-506. FEBS (Fed. Eur. Biochem. Soc.) Lett. 352:369–374. - PubMed
- Alexandre J, Lassalles JP, Kado RT. Opening of Ca2+channels in isolated red beet root vacuole membrane by inositol 1,4,5-trisphosphate. Nature (Lond) 1990;343:567–570.
- Berridge MJ. Inositol trisphosphate and calcium signaling. Nature (Lond) 1993;361:315–325. - PubMed
- Bezprozvanny I, Ehrlich BE. ATP modulates the function of inositol 1,4,5-trisphosphate-gated channels at two sites. Neuron. 1993;10:1175–1184. - PubMed
Publication types
MeSH terms
Substances
LinkOut - more resources
Full Text Sources
Miscellaneous
