Likelihood-mapping: a simple method to visualize phylogenetic content of a sequence alignment - PubMed (original) (raw)
Likelihood-mapping: a simple method to visualize phylogenetic content of a sequence alignment
K Strimmer et al. Proc Natl Acad Sci U S A. 1997.
Abstract
We introduce a graphical method, likelihood-mapping, to visualize the phylogenetic content of a set of aligned sequences. The method is based on an analysis of the maximum likelihoods for the three fully resolved tree topologies that can be computed for four sequences. The three likelihoods are represented as one point inside an equilateral triangle. The triangle is partitioned in different regions. One region represents star-like evolution, three regions represent a well-resolved phylogeny, and three regions reflect the situation where it is difficult to distinguish between two of the three trees. The location of the likelihoods in the triangle defines the mode of sequence evolution. If n sequences are analyzed, then the likelihoods for each subset of four sequences are mapped onto the triangle. The resulting distribution of points shows whether the data are suitable for a phylogenetic reconstruction or not.
Figures
Figure 1
The fully resolved tree topologies _T_1, _T_2, and _T_3 connecting four sequences _S_1, _S_2, _S_3, and _S_4.
Figure 2
Map of the probability vector P = (_p_1, _p_2, _p_3) onto an equilateral triangle. Barycentric coordinates are used, i.e. the lengths of the perpendiculars from point P to the triangle sides are equal to the probabilities p i. The corners _T_1, _T_2, and _T_3 represent three quartet topologies with corresponding coordinates (probabilities) (1, 0, 0), (0, 1, 0), and (0, 0, 1).
Figure 3
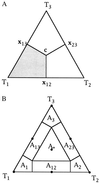
(A) Basins of attraction for the three topologies _T_1, _T_2, and _T_3. The gray area shows the region where the probability for tree _T_1 is largest. In the center c = (1/3, 1/3, 1/3) all trees are equally likely, at the points x12 = (1/2, 1/2, 0), x13 = (1/2, 0, 1/2), and x23 = (0, 1/2, 1/2) two trees have the same likelihood whereas the remaining one has probability zero. (B) The seven basins of attraction allowing not only fully resolved trees but also the star phylogeny and three regions where it is not possible to decide between two topologies. The dots indicate the corresponding seven attractors. _A_1, _A_2, _A_3 show the tree-like regions. _A_12, _A_13, _A_23represent the net-like regions and _A_∗ displays the star-like area.
Figure 4
Effect of sequence length (50, 100, 200, and 500 bp) on the distribution of P vectors for a simulated data set with 16 sequences. (Upper) Sequences evolving along a perfect star phylogeny. (Lower) Sequences evolving along a completely resolved tree. Sequences evolved according to the Jukes–Cantor model. The number of substitutions per site and per branch was 0.1. Each triangle shows a result of one simulation and all possible 1,820 P vectors were computed. If tree-like data were generated (Lower) the number of P vectors seems to decrease with increasing sequence length. This effect is due to the fact that identical P vectors fall on top of each other. Longer sequences increase the probability that one of the trees favored equals one. That is, most of the 1,820 P vectors superimpose each other in the corners of the triangles (cf. Table 1).
Figure 5
Likelihood-mapping analysis for two biological data sets. (Upper) The distribution patterns. (Lower) The occupancies (in percent) for the seven areas of attraction. (A) Cytochrome-b data from ref. . (B) Ribosomal DNA of major arthropod groups (15).
Figure 6
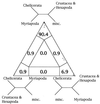
Four-cluster likelihood-mapping of ribosomal DNA (15). Sequences were split in four disjoint groups, misc. represents the nonarthropod sequences. The corners of the triangle are labeled with the corresponding tree topologies.
Similar articles
- Bayesian coestimation of phylogeny and sequence alignment.
Lunter G, Miklós I, Drummond A, Jensen JL, Hein J. Lunter G, et al. BMC Bioinformatics. 2005 Apr 1;6:83. doi: 10.1186/1471-2105-6-83. BMC Bioinformatics. 2005. PMID: 15804354 Free PMC article. - Maximum-likelihood analysis using TREE-PUZZLE.
Schmidt HA, von Haeseler A. Schmidt HA, et al. Curr Protoc Bioinformatics. 2007 Mar;Chapter 6:Unit 6.6. doi: 10.1002/0471250953.bi0606s17. Curr Protoc Bioinformatics. 2007. PMID: 18428792 - Effects of nucleotide sequence alignment on phylogeny estimation: a case study of 18S rDNAs of apicomplexa.
Morrison DA, Ellis JT. Morrison DA, et al. Mol Biol Evol. 1997 Apr;14(4):428-41. doi: 10.1093/oxfordjournals.molbev.a025779. Mol Biol Evol. 1997. PMID: 9100373 - SATe-II: very fast and accurate simultaneous estimation of multiple sequence alignments and phylogenetic trees.
Liu K, Warnow TJ, Holder MT, Nelesen SM, Yu J, Stamatakis AP, Linder CR. Liu K, et al. Syst Biol. 2012 Jan;61(1):90-106. doi: 10.1093/sysbio/syr095. Epub 2011 Dec 1. Syst Biol. 2012. PMID: 22139466 - Molecular Phylogenetics: Concepts for a Newcomer.
Ajawatanawong P. Ajawatanawong P. Adv Biochem Eng Biotechnol. 2017;160:185-196. doi: 10.1007/10_2016_49. Adv Biochem Eng Biotechnol. 2017. PMID: 27783136 Review.
Cited by
- Molecular epidemiology and phylogenetic analysis of Hepatitis B virus in a group of migrants in Italy.
Villano U, Lo Presti A, Equestre M, Cella E, Pisani G, Giovanetti M, Bruni R, Tritarelli E, Amicosante M, Grifoni A, Scarcella C, El-Hamad I, Pezzoli MC, Angeletti S, Ciccaglione AR, Ciccozzi M. Villano U, et al. BMC Infect Dis. 2015 Jul 25;15:287. doi: 10.1186/s12879-015-0994-9. BMC Infect Dis. 2015. PMID: 26209519 Free PMC article. - Comparative transcriptomics of ice-crawlers demonstrates cold specialization constrains niche evolution in a relict lineage.
Schoville SD, Simon S, Bai M, Beethem Z, Dudko RY, Eberhard MJB, Frandsen PB, Küpper SC, Machida R, Verheij M, Willadsen PC, Zhou X, Wipfler B. Schoville SD, et al. Evol Appl. 2020 Sep 11;14(2):360-382. doi: 10.1111/eva.13120. eCollection 2021 Feb. Evol Appl. 2020. PMID: 33664782 Free PMC article. - Combination of immune and viral factors distinguishes low-risk versus high-risk HIV-1 disease progression in HLA-B*5701 subjects.
Norström MM, Buggert M, Tauriainen J, Hartogensis W, Prosperi MC, Wallet MA, Hecht FM, Salemi M, Karlsson AC. Norström MM, et al. J Virol. 2012 Sep;86(18):9802-16. doi: 10.1128/JVI.01165-12. Epub 2012 Jul 3. J Virol. 2012. PMID: 22761389 Free PMC article. - Orthoptera-specific target enrichment (OR-TE) probes resolve relationships over broad phylogenetic scales.
Shin S, Baker AJ, Enk J, McKenna DD, Foquet B, Vandergast AG, Weissman DB, Song H. Shin S, et al. Sci Rep. 2024 Sep 13;14(1):21377. doi: 10.1038/s41598-024-72622-6. Sci Rep. 2024. PMID: 39271747 Free PMC article. - A common origin of complex life cycles in parasitic flatworms: evidence from the complete mitochondrial genome of Microcotyle sebastis (Monogenea: Platyhelminthes).
Park JK, Kim KH, Kang S, Kim W, Eom KS, Littlewood DT. Park JK, et al. BMC Evol Biol. 2007 Feb 2;7:11. doi: 10.1186/1471-2148-7-11. BMC Evol Biol. 2007. PMID: 17270057 Free PMC article.
References
- Swofford D L, Olsen G J, Waddell P J, Hillis D M. In: Molecular Systematics. Hillis D M, Moritz C, Mable B K, editors. Sunderland, MA: Sinauer; 1995. pp. 407–514.
- Bandelt H-J, Dress A. Adv Math. 1992;92:47–105.
- von Haeseler A, Churchill G A. J Mol Evol. 1993;37:77–85. - PubMed
Publication types
MeSH terms
LinkOut - more resources
Full Text Sources
Other Literature Sources


