In vivo activity-dependent plasticity at cortico-striatal connections: evidence for physiological long-term potentiation - PubMed (original) (raw)
In vivo activity-dependent plasticity at cortico-striatal connections: evidence for physiological long-term potentiation
S Charpier et al. Proc Natl Acad Sci U S A. 1997.
Abstract
The purpose of the present study was to investigate in vivo the activity-dependent plasticity of glutamatergic cortico-striatal synapses. Electrical stimuli were applied in the facial motor cortex and intracellular recordings were performed in the ipsilateral striatal projection field of this cortical area. Recorded cells exhibited the typical intrinsic membrane properties of striatal output neurons and were identified morphologically as medium spiny type I neurons. Subthreshold cortical tetanization produced either short-term posttetanic potentiation or short-term depression of cortically-evoked excitatory postsynaptic potentials. When coupled with a postsynaptic depolarization leading the membrane potential to a suprathreshold level, the tetanus induced long-term potentiation (LTP) of cortico-striatal synaptic transmission. Induction of striatal LTP was prevented by intracellular injection of a calcium chelator suggesting that this synaptic plasticity involves an increase of postsynaptic free calcium concentration. Contrasting with previous in vitro studies our findings demonstrate that LTP constitutes the normal form of use-dependent plasticity at cortico-striatal synapses. Since excitation of striatal neurons produces a disinhibition of premotor networks, LTP at excitatory striatal inputs should favor the initiation of movements and therefore could be critical for the functions of basal ganglia in motor learning.
Figures
Figure 1
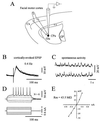
Scheme of the experimental set-up and electrophysiological properties of recorded neurons. (A) In vivo intracellular recordings were obtained from striatal neurons (darck circle) located in the caudate-putamen (CPu) region related to the ipsilateral facial motor cortex. Electrical stimuli applied in this cortical area, through a bipolar stimulating electrode, induce monosynaptic excitation of striatal cells via glutamatergic connections (Glu) (see Material and Methods for details). GP, cc, and cx indicate, respectively, the globus pallidus, the corpus callosum, and the cerebral cortex. Data presented in B_–_E were obtained from the same neuron. (B) Superimposed (n = 3) EPSPs elicited by single cortical stimuli delivered at the indicated frequency. (C) Two periods of spontaneous activity showing the presence of regular subthreshold oscillations of large amplitude. In this cell, spontaneous action potentials were not observed at rest (resting membrane potential = −89 mV). (D and E) I–V relationships of striatal neurons. The membrane potential changes (D, upper traces) in response to injection of current pulses (D, lower traces) were measured after averaging. Note the tonic firing triggered by a depolarizing pulse of + 0.6 nA. The corresponding I–V plot was then constructed (E). The input resistance (Rm) was calculated by the slope of the linear portion of the I–V curve obtained from a series of hyperpolarizing currents. This neuron labeled with biocytin exhibited typical morphological features of spiny type I neurons (not shown).
Figure 2
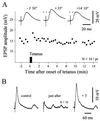
Effects of subthreshold cortical tetanic stimulation on striatal neurons at resting membrane potential. (A) Example of posttetanic potentiation. The graph shows the time course of the amplitude of striatal EPSPs evoked by single test stimuli applied in the facial motor cortex. ▪, The cortical tetanization (train of 1 sec at 100 Hz repeated two times at 10-sec interval, resting membrane potential = −73 mV). The same intensity was used for the test stimulus and the tetanic stimulation. Note that after a short-term posttetanic potentiation, the synaptic efficacy recovered its control level. Traces represent the averaging of 10 successive EPSPs obtained at the indicated times before and after tetanus. The dashed lines indicate the amplitude of the control EPSPs. (B) Example of a short-term depression. Traces represent averaged evoked EPSPs (n = 10) obtained at the indicated periods. Parameters of tetanus: train of 2 sec at 100 Hz repeated 4 times at 10-sec interval, resting membrane potential = −85 mV.
Figure 3
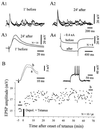
LTP is induced by cortical tetanic stimulation coupled with postsynaptic depolarization. Results illustrated in A and B are from two separated experiments. (A) Demonstration of striatal LTP. In this experiment, the tetanus was delivered during membrane depolarization induced by an injection of dc current (+0.8 nA) leading the membrane potential from −72 to −37 mV (tetanus parameters: train of 2.5 sec at 100 Hz repeated four times at 10-sec interval). (A1–2) Superimposed EPSPs (n = 3) recorded 1 min before (A1) and 24 min after (A2) conditioning. (A3) Superimposition of averaged EPSPs (n = 10) showing that the kinetic of synaptic responses was unchanged after potentiation. (A4) The constancy of the mean voltage response to −0.4 nA indicates the input resistance stability of the cell. (B) Time course of striatal LTP. The conditioning protocol consisted in a preliminary depolarization induced by an injection of dc current (+1 nA) followed by tetanic stimulation (train of 1 sec at 100 Hz repeated four times at 10-sec interval). (Inset, Left) Superimposed averaged EPSPs for the periods indicated in the plot below (a, control; b, from +65′ to +68′ after tetanus) showing that synaptic potentiation was still present more than 1 hr after conditioning (P < 0.0005). (Inset, Right) The intrinsic membrane excitability tested by depolarizing current (+0.8 nA) was not modified, as indicated by the superimposed traces obtained just before tetanization and at the end of the recording session.
Figure 4
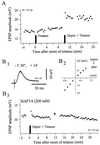
Involvement of postsynaptic calcium in cortico-striatal LTP. (A) Demonstration that LTP induction needs postsynaptic depolarization. The graph shows the time course of the EPSPs amplitude from a striatal neuron in which two different conditioning protocols were applied. In the first, the cortical trains (100 Hz for 1 sec, repeated three times at 10-sec interval) were applied at rest (resting membrane potential = −81 mV). In the second, the same tetanus was delivered in conjunction with membrane depolarization (from −81 mV to −60 mV, idc = +0.7 nA). Note the rapid and persistent synaptic potentiation induced by the pairing protocol. (B) Induction of striatal LTP is blocked by postsynaptic injection of a calcium chelator. In this experiment where the striatal neuron was injected with BAPTA (200 mM) the tetanic stimulation (100 Hz for 1 sec, repeated three times at 10-sec interval) was associated with membrane depolarization (from −85.7 to −60 mV; idc = + 2.5 nA). (B1) Superimposed averaged EPSPs (n = 10) recorded at the indicated time after tetanus. (B2) I–V relationship obtained before (□) and after (▴) tetanization showing the input resistance constancy of the recorded striatal cell. Each data point represents the mean value of at least eight successive traces. (B3) After BAPTA injection the pairing protocol caused a short-term posttetanic potentiation immediately followed by the recovery of EPSPs amplitude to control values. (→) The recording period used to measure the input resistance of the neuron (see B2).
Similar articles
- In vivo induction of striatal long-term potentiation by low-frequency stimulation of the cerebral cortex.
Charpier S, Mahon S, Deniau JM. Charpier S, et al. Neuroscience. 1999;91(4):1209-22. doi: 10.1016/s0306-4522(98)00719-2. Neuroscience. 1999. PMID: 10391430 - Bidirectional activity-dependent plasticity at corticostriatal synapses.
Fino E, Glowinski J, Venance L. Fino E, et al. J Neurosci. 2005 Dec 7;25(49):11279-87. doi: 10.1523/JNEUROSCI.4476-05.2005. J Neurosci. 2005. PMID: 16339023 Free PMC article. - Long-term synaptic depression in the striatum: physiological and pharmacological characterization.
Calabresi P, Maj R, Pisani A, Mercuri NB, Bernardi G. Calabresi P, et al. J Neurosci. 1992 Nov;12(11):4224-33. doi: 10.1523/JNEUROSCI.12-11-04224.1992. J Neurosci. 1992. PMID: 1359031 Free PMC article. - Neurotransmitter roles in synaptic modulation, plasticity and learning in the dorsal striatum.
Lovinger DM. Lovinger DM. Neuropharmacology. 2010 Jun;58(7):951-61. doi: 10.1016/j.neuropharm.2010.01.008. Epub 2010 Jan 21. Neuropharmacology. 2010. PMID: 20096294 Free PMC article. Review. - Dopamine, acetylcholine and nitric oxide systems interact to induce corticostriatal synaptic plasticity.
Centonze D, Gubellini P, Pisani A, Bernardi G, Calabresi P. Centonze D, et al. Rev Neurosci. 2003;14(3):207-16. doi: 10.1515/revneuro.2003.14.3.207. Rev Neurosci. 2003. PMID: 14513864 Review.
Cited by
- Distinct roles of D1 and D5 dopamine receptors in motor activity and striatal synaptic plasticity.
Centonze D, Grande C, Saulle E, Martin AB, Gubellini P, Pavón N, Pisani A, Bernardi G, Moratalla R, Calabresi P. Centonze D, et al. J Neurosci. 2003 Sep 17;23(24):8506-12. doi: 10.1523/JNEUROSCI.23-24-08506.2003. J Neurosci. 2003. PMID: 13679419 Free PMC article. - Coincidence of cholinergic pauses, dopaminergic activation and depolarisation of spiny projection neurons drives synaptic plasticity in the striatum.
Reynolds JNJ, Avvisati R, Dodson PD, Fisher SD, Oswald MJ, Wickens JR, Zhang YF. Reynolds JNJ, et al. Nat Commun. 2022 Mar 11;13(1):1296. doi: 10.1038/s41467-022-28950-0. Nat Commun. 2022. PMID: 35277506 Free PMC article. - Synaptic plasticity in the mesolimbic system: therapeutic implications for substance abuse.
Chen BT, Hopf FW, Bonci A. Chen BT, et al. Ann N Y Acad Sci. 2010 Feb;1187:129-39. doi: 10.1111/j.1749-6632.2009.05154.x. Ann N Y Acad Sci. 2010. PMID: 20201850 Free PMC article. Review. - The group 2 metabotropic glutamate receptor agonist LY379268 rescues neuronal, neurochemical and motor abnormalities in R6/2 Huntington's disease mice.
Reiner A, Lafferty DC, Wang HB, Del Mar N, Deng YP. Reiner A, et al. Neurobiol Dis. 2012 Jul;47(1):75-91. doi: 10.1016/j.nbd.2012.03.025. Epub 2012 Mar 27. Neurobiol Dis. 2012. PMID: 22472187 Free PMC article. - Dopamine and cAMP-regulated phosphoprotein 32 kDa controls both striatal long-term depression and long-term potentiation, opposing forms of synaptic plasticity.
Calabresi P, Gubellini P, Centonze D, Picconi B, Bernardi G, Chergui K, Svenningsson P, Fienberg AA, Greengard P. Calabresi P, et al. J Neurosci. 2000 Nov 15;20(22):8443-51. doi: 10.1523/JNEUROSCI.20-22-08443.2000. J Neurosci. 2000. PMID: 11069952 Free PMC article.
References
- Thomson R F. Science. 1986;233:941–947. - PubMed
- Graybiel A M. Curr Opin Neurobiol. 1995;5:733–741. - PubMed
- Reubi J C, Cuenod M. Brain Res. 1979;89:107–119. - PubMed
- Herrling P L. Neuroscience. 1985;14:417–426. - PubMed
Publication types
MeSH terms
LinkOut - more resources
Full Text Sources


