Cross talk between adhesion molecules: control of N-cadherin activity by intracellular signals elicited by beta1 and beta3 integrins in migrating neural crest cells - PubMed (original) (raw)
Cross talk between adhesion molecules: control of N-cadherin activity by intracellular signals elicited by beta1 and beta3 integrins in migrating neural crest cells
F Monier-Gavelle et al. J Cell Biol. 1997.
Abstract
During embryonic development, cell migration and cell differentiation are associated with dynamic modulations both in time and space of the repertoire and function of adhesion receptors, but the nature of the mechanisms responsible for their coordinated occurrence remains to be elucidated. Thus, migrating neural crest cells adhere to fibronectin in an integrin-dependent manner while maintaining reduced N-cadherin-mediated intercellular contacts. In the present study we provide evidence that, in these cells, the control of N-cadherin may rely directly on the activity of integrins involved in the process of cell motion. Prevention of neural crest cell migration using RGD peptides or antibodies to fibronectin and to beta1 and beta3 integrins caused rapid N-cadherin-mediated cell clustering. Restoration of stable intercellular contacts resulted essentially from the recruitment of an intracellular pool of N-cadherin molecules that accumulated into adherens junctions in tight association with the cytoskeleton and not from the redistribution of a preexisting pool of surface N-cadherin molecules. In addition, agents that cause elevation of intracellular Ca2+ after entry across the plasma membrane were potent inhibitors of cell aggregation and reduced the N-cadherin- mediated junctions in the cells. Finally, elevated serine/ threonine phosphorylation of catenins associated with N-cadherin accompanied the restoration of intercellular contacts. These results indicate that, in migrating neural crest cells, beta1 and beta3 integrins are at the origin of a cascade of signaling events that involve transmembrane Ca2+ fluxes, followed by activation of phosphatases and kinases, and that ultimately control the surface distribution and activity of N-cadherin. Such a direct coupling between adhesion receptors by means of intracellular signals may be significant for the coordinated interplay between cell-cell and cell-substratum adhesion that occurs during embryonic development, in wound healing, and during tumor invasion and metastasis.
Figures
Figure 1
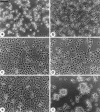
Inhibition of neural crest cell adhesion to fibronectin by RGDS peptides or antibodies to fibronectin and integrins provokes cell clustering. Neural crest cells were cultured for 15 h on fibronectin substrata at 3 μg/ml. Cells were subsequently confronted for 5 h with control GR
DG
S peptides (a), RGDS peptides (b) both at 1 mg/ml, mAb 333 to fibronectin at 50 μg/ml (c), polyclonal antibodies 2992 anti–β1 integrins at 1 mg/ml (d), mAb HP2/1 to the α4 integrin subunit at 40 μg/ml (e), and mAb LM609 ascite to the αVβ3 integrin at dilution 1:100 (f). In the presence of RGDS peptides and antibodies to fibronectin and β1 integrins, most neural crest cells are retracted and regrouped into compact clusters. In the presence of antibodies to the α4 and αVβ3 integrins, cells remain flattened but form a monolayer of tightly adherent cells. Bar, 50 μm.
Figure 2
Neural crest cell aggregation induced by RGDS peptides and antibodies to integrins is mediated by N-cadherin. Effect of antibodies to N-cadherin on neural crest cell aggregation induced by RGDS peptides at 1 mg/ml (a and b), by mAb HP2/1 to α4 integrin subunit at 40 μg/ml (c), and by mAb LM609 ascite to the αVβ3 integrin at dilution 1:100 (d). Cells were confronted during 5 h with peptides or anti-integrin antibodies in the presence of antibodies to N-cadherin either inhibitory (A-CAM CC-11; a, c, and d) or noninhibitory (A-CAM ID-7.2.3; b), both at 5 μg/ml. Note that cells treated with both anti–N-cadherin antibodies and antibodies to α4 or αVβ3 integrins are less spread than when antibodies to N-cadherin are omitted (compare with Fig. 1, e and f). Bar, 50 μm.
Figure 3
Immunofluorescence staining for N-cadherin on neural crest cells confronted with RGDS peptides or antibodies to integrins. Cells cultured on fibronectin were incubated for 5 h to control nonperturbing peptides (a), to RGDS peptides at 1 mg/ml (b), to mAb CSAT to β1 integrins at 20 μg/ml (c), or to mAb HP2/1 to α4 integrin subunit at 40 μg/ml (d), fixed in 3.7% formaldehyde in the presence of 0.2% Triton X-100, and processed for immunofluorescence staining. Under normal conditions, N-cadherin immunoreactivity is essentially concentrated at the tip of cell processes in contact with other cells (arrows). In cells aggregated by RGDS peptides, N-cadherin staining is conspicuous over most of the cell surface, particularly in regions of cell–cell contacts. In cells treated with mAb CSAT or HP2/1, staining is essentially accumulated in the cell periphery in areas of intercellular contacts. Bar, 20 μm.
Figure 4
Immunoblot and immunoprecipitation analyses of N-cadherin expression and localization in neural crest cells using antibodies to the cytoplasmic domain of the N-cadherin molecule. (a) Immunoblot of total cell extracts (lanes 1–3) and of Triton X-100–insoluble fractions (lanes 4–6) of untreated cells (lanes_1_ and 4) and of cells confronted with the mAb CSAT anti-β1 integrin at 20 μg/ml (lanes 2 and 5) and RGDS peptides at 1 mg/ml (lanes 3 and 6). Equal amounts of material were loaded in lanes_1–3_ and 4–6, respectively. The relative intensities of the N-cadherin bands in the Triton X-100–insoluble fractions measured using a PhosphorImager were estimated to be 100, 133, and 145% for the untreated, mAb CSAT–treated, and RGDS peptide– treated cells, respectively. (b) Immunoprecipitation of extracts of metabolically labeled neural crest cells in the absence of inhibitors of substratum adhesion (lane 1) or in the presence of the mAb CSAT anti-β1 integrin at 20 μg/ml (lane 2) and RGDS peptides at 1 mg/ml (lane 3). Equal amounts of material were loaded in each lane. Arrows point at N-cadherin and its biosynthetic precursor at 130 and 135 kD, respectively, and arrowheads at α-, β-, and γ-catenins at ∼105, 95, and 85 kD. Positions of molecular mass markers are indicated on the left.
Figure 5
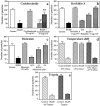
Neural crest cell aggregation is mediated by N-cadherin molecules recruited from an intracellular pool. (a–c) Effects of inhibitors of macromolecule synthesis (cycloheximide; a) and secretion (brefeldin and monensin; b and c) on neural crest cell aggregation induced by RGDS peptides at 1 mg/ml. Cells were preincubated with cycloheximide for 1–5 h or with brefeldin A or monensin for 30 min, before addition of the peptides for the subsequent 5 h. (d) Effect of low temperatures on neural crest cell aggregation. Cells were confronted with RGDS peptides at 1 mg/ml at 37° or 18°C for 5 h or were incubated first at 18°C in the presence or not of the peptides for 3 h followed by a 2-h incubation at 37°C. (e) Effect of removal of the surface pool of N-cadherin molecules on neural crest cell aggregation. Cells were treated or not for 5 min with a trypsin solution at 0.001% in Ca2+-free medium before addition of the RGDS peptides at 1 μg/ml for the subsequent 5 h. Results are expressed as the number of particles that were counted in an arbitrarily defined region of each neural crest outgrowth and covering ∼0.2 mm2. Values represent the mean ± SD of a minimum of eight measurements in at least two independent experiments.
Figure 6
(a and b) Cell–cell interactions among cells confronted during 5 h with peptides in the presence of cycloheximide at 0.1 mg/ml (a) and brefeldin A at 1 μg/ml (b). In the case of cycloheximide, cells were preincubated with the drug for ∼5 h before addition of the peptide. (c–f) Cell–cell interactions among cells treated (c) or not (d) with RGDS peptides at 18°C during 5 h and among cells treated first at 18°C during 3 h and then at 37°C during 2 h either in the absence (e) or presence (f) of RGDS peptides at 1 mg/ml. Bar, 50 μm.
Figure 7
Immunoblotting analyses of N-cadherin expression and localization in cells treated with inhibitors of protein synthesis and secretion using antibodies to the cytoplasmic domain of the N-cadherin molecule. (a) Total cell extracts of untreated cells (lane 1) and of cells treated with RGDS peptides at 1 mg/ml alone (lane 2) or in combination with cycloheximide at 0.1 μg/ml (lane 3), brefeldin A at 1 μg/ml (lane 4), and brefeldin A plus cycloheximide (lane 5). (b) Triton X-100–insoluble fractions of untreated cells (lane 1) and of cells treated with RGDS peptides at 1 mg/ml in combination with brefeldin A at 1 μg/ml (lane 2) or alone (lane 3). The relative intensities of the N-cadherin bands in the Triton X-100–insoluble fractions measured using a PhosphorImager were estimated to be 100, 108, and 161% for lanes 1, 2, and 3, respectively. Arrows point at N-cadherin and its biosynthetic precursor at 130 and 135 kD. Positions of molecular mass markers are indicated on the left. Equal amounts of material were loaded in each lane in a and b, respectively.
Figure 8
Effect of removal of the surface pool of N-cadherin molecules on neural crest cell aggregation. (a and b) Morphology of neural crest cells (a) and immunofluorescence staining for N-cadherin on neural crest cells (b), immediately after a 5-min treatment with a trypsin solution at 0.001% in Ca2+-free medium. N-cadherin staining has almost entirely disappeared from the cell surface including from intercellular contacts (arrow) and is only detectable intracellularly. (c) Cell–cell interactions among neural crest cells confronted for 5 h with RGDS peptides at 1 mg/ml after trypsin treatment. Note that cells form aggregates as compact as untreated cells. Bars: (a) 50 μm; (b) 20 μm.
Figure 9
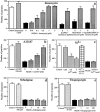
Quantitation of the effect of agents that affect transmembrane Ca2+ fluxes and intracellular Ca2+ concentration on the aggregation of neural crest cells. In c, the mAb A-CAM CC-11 was applied at the concentration of 5 μg/ml. Results are expressed as the number of particles that were counted in an arbitrarily defined region of each neural crest outgrowth and covering ∼0.2 mm2, after 5 h of incubation with the agent combined or not with RGDS peptides and antibodies to integrins. Values represent the mean ± SD of a minimum of eight measurements in at least two independent experiments.
Figure 10
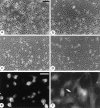
(a and b) Effect of the Ca2+ ionophore ionomycin on neural crest cell aggregation induced by RGDS peptides at 1 mg/ml. Cells were confronted during 5 h with ionomycin at 1 μM in the presence (a) or absence (b) of RGDS peptides at 1 mg/ml. (c and d) Effects of Ni2+, a blocker of voltage-independent Ca2+ channels (c), and nifedipine, a blocker of voltage-dependent Ca2+ channels (d), on neural crest cell cohesion in the absence of RGDS peptides after 5 h of treatment. (e and f) Immunofluorescence staining for N-cadherin on neural crest cells treated with ionomycin at 1 μM in the presence (e) or absence (f) of RGDS peptides. Note that N-cadherin staining has almost entirely disappeared from the regions of cell–cell contacts in cells treated with ionomycin alone (arrow). Bars: (a) 50 μm; (e) 20 μm.
Figure 11
Immunoblotting analyses of N-cadherin expression and localization in cells treated with Ca2+ ionophores using antibodies to the cytoplasmic domain of the N-cadherin molecule. (a) Total cell extracts of untreated cells (lane 1) and of cells treated with RGDS peptides at 1 mg/ml in combination with ionomycin at 1 μM (lane 2). (b) Triton X-100–insoluble fractions of untreated cells (lane 1) and of cells treated with ionomycin at 1 μM (lane 2). The relative intensities of the N-cadherin bands in the Triton X-100–insoluble fractions measured using a PhosphorImager were estimated to be 100 and 85% for the untreated and the ionomycin-treated cells, respectively. Arrows point at N-cadherin at 130 kD. Positions of molecular mass markers are indicated on the left. Equal amounts of material were loaded in each lane in _a_and b, respectively.
Figure 12
Analysis of N-cadherin phosphorylation in neural crest cells confronted with RGDS peptides. (a) Immunoprecipitation of total cell extracts of 32P-labeled untreated neural crest cells (lane 1) and cells treated with RGDS peptides at 1 mg/ml (lane 2) using antibodies to the cytoplasmic domain of the N-cadherin molecule. (b) Tyrosine phosphorylation of N-cadherin in neural crest cells. Extracts of untreated (lane 1) and RGDS-treated (lane 2) neural crest cells first were immunoprecipitated with antibodies to the cytoplasmic domain of N-cadherin, and then were analyzed for tyrosine phosphorylation using immunoblotting with antibodies to phosphotyrosine. (Lanes 3 and 4) Total extracts of untreated and RGDS-treated cells, respectively, subjected to immunoblotting using antibodies to phosphotyrosine. The arrow points at N-cadherin, and arrowheads point at α-, β-, and γ-catenins at ∼105, 95, and 85 kD. Positions of molecular mass markers are indicated on the left. Equal amounts of material were loaded in each lane in a and b, respectively.
Similar articles
- Control of N-cadherin-mediated intercellular adhesion in migrating neural crest cells in vitro.
Monier-Gavelle F, Duband JL. Monier-Gavelle F, et al. J Cell Sci. 1995 Dec;108 ( Pt 12):3839-53. doi: 10.1242/jcs.108.12.3839. J Cell Sci. 1995. PMID: 8719890 - Beta3-integrins rather than beta1-integrins dominate integrin-matrix interactions involved in postinjury smooth muscle cell migration.
Slepian MJ, Massia SP, Dehdashti B, Fritz A, Whitesell L. Slepian MJ, et al. Circulation. 1998 May 12;97(18):1818-27. doi: 10.1161/01.cir.97.18.1818. Circulation. 1998. PMID: 9603537 - Cellular localization and signaling activity of beta-catenin in migrating neural crest cells.
de Melker AA, Desban N, Duband JL. de Melker AA, et al. Dev Dyn. 2004 Aug;230(4):708-26. doi: 10.1002/dvdy.20091. Dev Dyn. 2004. PMID: 15254905 - Role of adhesion molecules in the genesis of the peripheral nervous system in avians.
Duband JL. Duband JL. J Physiol (Paris). 1990;84(1):88-94. J Physiol (Paris). 1990. PMID: 2193150 Review. - Extracellular matrix receptors and the differentiation of human megakaryocytes in vitro.
Molla A, Mossuz P, Berthier R. Molla A, et al. Leuk Lymphoma. 1999 Mar;33(1-2):15-23. doi: 10.3109/10428199909093721. Leuk Lymphoma. 1999. PMID: 10194117 Review.
Cited by
- Phosphoinositide-3 kinase-Rac1-c-Jun NH2-terminal kinase signaling mediates collagen I-induced cell scattering and up-regulation of N-cadherin expression in mouse mammary epithelial cells.
Shintani Y, Wheelock MJ, Johnson KR. Shintani Y, et al. Mol Biol Cell. 2006 Jul;17(7):2963-75. doi: 10.1091/mbc.e05-12-1123. Epub 2006 Apr 19. Mol Biol Cell. 2006. PMID: 16624865 Free PMC article. - Enforced expression of the transcription factor HOXD3 under the control of the Wnt1 regulatory element modulates cell adhesion properties in the developing mouse neural tube.
Taniguchi Y, Tanaka O, Sekiguchi M, Takekoshi S, Tsukamoto H, Kimura M, Imai K, Inoko H. Taniguchi Y, et al. J Anat. 2011 Nov;219(5):589-600. doi: 10.1111/j.1469-7580.2011.01425.x. Epub 2011 Sep 16. J Anat. 2011. PMID: 21929743 Free PMC article. - Hox proteins as regulators of extracellular matrix interactions during neural crest migration.
Howard AGA 4th, Uribe RA. Howard AGA 4th, et al. Differentiation. 2022 Nov-Dec;128:26-32. doi: 10.1016/j.diff.2022.09.003. Epub 2022 Oct 4. Differentiation. 2022. PMID: 36228422 Free PMC article. Review. - Sonic hedgehog regulates integrin activity, cadherin contacts, and cell polarity to orchestrate neural tube morphogenesis.
Fournier-Thibault C, Blavet C, Jarov A, Bajanca F, Thorsteinsdóttir S, Duband JL. Fournier-Thibault C, et al. J Neurosci. 2009 Oct 7;29(40):12506-20. doi: 10.1523/JNEUROSCI.2003-09.2009. J Neurosci. 2009. PMID: 19812326 Free PMC article. - Molecular Crosstalk between Integrins and Cadherins: Do Reactive Oxygen Species Set the Talk?
Goitre L, Pergolizzi B, Ferro E, Trabalzini L, Retta SF. Goitre L, et al. J Signal Transduct. 2012;2012:807682. doi: 10.1155/2012/807682. Epub 2011 Dec 13. J Signal Transduct. 2012. PMID: 22203898 Free PMC article.
References
- Akitaya T, Bronner-Fraser M. Expression of cell adhesion molecules during initiation of and cessation of neural crest cell migration. Dev Dyn. 1992;194:12–20. - PubMed
- Akiyama SK, Hasegawa E, Hasegawa T, Yamada KM. The interaction of fibronectin fragments with fibroblastic cells. J Biol Chem. 1985;260:13256–13260. - PubMed
- Behrens J, Vakaet L, Friis R, Winterhager E, Van Roy F, Mareel MM, Birchmeier W. Loss of epithelial differentiation and gain of invasiveness correlates with tyrosine phosphorylation of the E-cadherin/β-catenin complex in cells transformed with a temperature-sensitive v-SRC gene. J Cell Biol. 1993;120:757–766. - PMC - PubMed
Publication types
MeSH terms
Substances
LinkOut - more resources
Full Text Sources
Other Literature Sources
Research Materials
Miscellaneous


