Neurons promote macrophage proliferation by producing transforming growth factor-beta2 - PubMed (original) (raw)
Neurons promote macrophage proliferation by producing transforming growth factor-beta2
A Dobbertin et al. J Neurosci. 1997.
Abstract
The infiltration of bone marrow-derived macrophages into the CNS contributes to growth and reactions of microglia during development or after brain injury. The proliferation of microglial cells is stimulated by colony-stimulating factor 1 (CSF-1), an astrocyte-produced growth factor that acts on mononuclear phagocytes. In the present study, we have shown, using an in vitro model system, that rodent neurons obtained from the developing cerebral cortex produce a soluble factor that strongly enhances the proliferation of macrophages cultured in the presence of CSF-1. Both macrophages isolated from the developing brain and those from the adult bone marrow were stimulated. Kinetic analyses of [3H]thymidine incorporation into macrophages indicated that their response to the neuron-derived factor involved a shortening of the cycle of proliferating cells. The effect of neurons on macrophages was blocked in the presence of antibodies neutralizing transforming growth factor-beta2 (TGF-beta2), whereas recombinant TGF-beta2 stimulated macrophage proliferation in the presence of CSF-1. Neuronal secretion of TGF-beta2 was confirmed by reverse transcription-PCR detection of TGF-beta2 transcripts and immunodetection of the protein within neurons and in their culture medium. In situ hybridization and immunohistochemical experiments showed neuronal expression of TGF-beta2 in sections of cerebral cortex obtained from 6-d-old rats, an age at which extensive developmental recruitment of macrophages occurs in this cerebral region. Altogether, our results provide direct evidence that neurons have the capacity to promote brain macrophage proliferation and demonstrate the role of TGF-beta2 in this neuronal function.
Figures
Fig. 1.
Influence of neurons and CSF-1 on BMM growth. BMMs were seeded at a density of 10,000 cells/well in CDM supplemented with L9CM or rhCSF-1 and 2% FCS. Cells were cultured for 96 hr with neurons (hatched bars) or without neurons (open bars) added for the last 72 hr. At the end of the culture, the number of BMM was determined by counts in 15 fields for each well as described in Materials and Methods. Each value is the mean number of cells ± SEM from four wells in one experiment representative of three independent experiments. Comparison between numbers of BMMs in the presence and absence of neurons was performed for each CSF-1 concentration using Student’s t test (*p < 0.05).
Fig. 2.
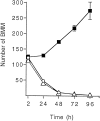
Effect of CSF-1 and TGF-β2 on the time course of BMM growth. BMMs were seeded at a density of 10,000 cells/well in CDM supplemented with 2% FCS with or without 10 ng/ml rhCSF-1 or 0.1 ng/ml rhTGF-β2. The number of BMMs was determined at different times after cell plating. Values are mean number of cells ± SEM from four wells in one experiment representative of two independent experiments.Open circles, Culture without recombinant cytokines;filled squares, culture with rhCSF-1; open triangles, culture with rhTGF-β2. In the presence of CSF-1, the estimated proportion of BMM recovered 24 hr after cell plating was 50%; from this time point, the number of BMMs increased significantly within 24 hr (p < 0.05). Statistical analyses were performed by one-way ANOVA followed by Dunnett’s test.
Fig. 3.
Effects of neurons and CSF-1 on the time course of DNA synthesis in quiescent BMMs. Isolated BMMs were cultured for 2 d in the presence of CSF-1 (20% L9CM) and washed, and synchronization of the cultures in a growth-arrested phase was obtained by a 24 hr incubation in CDM free of CSF-1. Cells were then incubated in CDM supplemented with L9CM and 1 μCi/ml [3H]thymidine with or without neurons. At indicated times, [3H]thymidine incorporation was stopped, and macrophages were processed for autoradiography. Results are from one experiment representative of three independent experiments. Values are presented as percentage of labeled nuclei (mean ± SEM) determined in four wells for each condition.Filled squares, Percentage of labeled macrophage nuclei after coculture with neurons; open circles, control without neurons. Comparison of the proportions of labeled BMMs cultured with or without neurons was performed at different times using Student’s t test (16 hr, p = 0.0002; 20 hr, p = 0.06).
Fig. 4.
Effect of different neuronal populations on BMM growth. Neurons from different CNS regions were seeded on glass coverslips (4 × 10⁵ cells/coverslip) and grown for different times before coculture with BMM in CDM supplemented with 20% L9CM. Cx 1DIV, Cx 7DIV, Neurons from E17 cerebral cortex 1 or 7 d in vitro before coculture;Mes, mesencephalic neurons from E14 rat embryos 1 d_in vitro_ before coculture; Cb, P6 cerebellar neurons 3 d in vitro before coculture. The numbers of BMMs counted after 72 hr of coculture are expressed as percentages of the mean control value set as 100% (BMMs in wells without added neurons). Each value is the mean ± SEM from counts in four wells in one experiment representative of three independent experiments. The actual number of BMMs counted in control conditions was 126 ± 23. Coculture and control values were compared using Student’s t test (*p < 0.01).
Fig. 5.
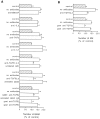
Neutralization of neuronal stimulation by different anti-TGF-β antibodies. Cocultures were all performed in CDM supplemented with 2% FCS and 10 ng/ml rhCSF-1. Antibodies were added together with neurons into wells previously seeded with BMM (A) or BM (B). Final concentrations of added antibodies were 20 μg/ml for polyclonal anti-TNF-α antibodies, anti-IL7 mAb, anti-TGF-β2 and -β3 mAbs, and control unrelated IgG2b or 10 μg/ml for other mAbs or polyclonal antibodies. For each antibody, the results of one experiment representative of at least two independent experiments are shown.Hatched bar, Control number (set as 100%) of BMMs or BMs cultured without neurons. Open bar, Number (percentage of control) of BMMs (A) or BMs (B) counted at the end of 72 hr cocultures in the presence or absence of antibodies. Values are mean ± SEM from counts in four wells. The actual numbers of cells in the seven (A) and two (B) controls were A, 68 ± 10, 222 ± 14, 104 ± 7, 42 ± 2, 420 ± 12, 64 ± 2, 308 ± 20;B, 123 ± 10 and 63 ± 8 (from_top_ to bottom). Neuronal stimulation without antibodies compared with control values (without neurons) were all significant (p < 0.01;p < 0.05 for the experiment performed with anti-TGF-β2 and -β3 antibodies). Addition of unrelated mAbs, rabbit IgGs, or monospecific antibodies directed against GM-CSF, IL-3, IL-7, TNF-α, or TGF-β3 did not significantly alter neuronal stimulation. Comparisons between anti-TGF-β antibodies (mAbs neutralizing two or three isoforms or rabbit monospecific anti-TGF-β2) and unrelated IgGs of matched isotype or species confirmed directly the specificity of blocking effects (in all cases p < 0.05). Significant differences were also checked between goat monospecific anti-TGF-β2 and anti-TGF-β3 in cocultures with BMMs (p < 0.05) or BMs (p < 0.01). Statistical analyses were performed using one-way ANOVA followed by multiple comparison Bonferroni’s test.
Fig. 6.
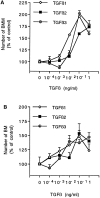
Dose–response effect of recombinant TGF-βs on BMM (A) and BM (B) growth. Cells were cultured for 96 hr in CDM supplemented with 2% FCS and 10 ng/ml rhCSF-1. TGF-β isoforms were added daily to culture at indicated final concentrations for the last 72 hr. The number of macrophages in each condition is given as percentage of mean control value obtained from wells without TGF-β (set as 100%). Data are mean ± SEM of five determinations from one experiment representative of five (BMM) or three (BM) independent experiments. Actual control numbers of BMs and BMMs were 54 ± 6 and 222 ± 9, respectively. Significant increases in macrophage number compared with control values were determined by ANOVA followed by Dunnett’s test. BMM cultures (A), p < 0.01 from 0.01 ng/ml for TGF-β1 and from 0.1 ng/ml for TGF-β2 and -β3. BM cultures (B), p < 0.05 from 0.1 ng/ml for TGF-β1, and p < 0.01 from 0.1 ng/ml for TGF-β2 and from 0.01 ng/ml for TGF-β3.
Fig. 7.
Reverse transcription-PCR and Southern blot analysis of TGF-β mRNA in neurons and macrophages. Total RNA was extracted from 4-d-old cultures of BMs, BMMs, or neurons derived from E17 cerebral cortex. Autoradiograms were obtained by Southern hybridization of amplified fragments as described in Materials and Methods. Lane 1, Controls (mouse brain for TGF-β1, rat epithelial liver cell line for TGF-β2, and peripheral nerve ganglions mRNA for TGF-β3); lanes 2 and 3, neurons cultured in CDM without (lane 2) or with (lane 3) 10 ng/ml rhCSF-1 and 2% FCS added for the last 72 hr; lane 4, BMMs; lane 5, BMs. Macrophages were cultured in CDM supplemented with 10 ng/ml rhCSF-1 and 2% FCS.
Fig. 8.
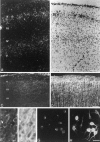
Expression of TGF-β2 by neurons of the cerebral cortex in vivo and in vitro. A, B, In situ hybridization dark-field (A) and bright-field (B) views of two different sections through the frontal part of the rat cerebral cortex at postnatal day 6. Cortical layers_II–V_ are marked. The dark-field view shows accumulation of TGF-β2 mRNA in cortical layers II and IV. Scale bar, 100 μm.C–F, Double immunofluorescent staining of P6 frontal cortex. C, E, anti-TGF-β2 staining (FITC); D, F, same fields stained with anti-MAP2 (TRITC). Scale bars:C, D, 100 μm; E, F, 25 μm.Arrows in E and F mark a cell body double-stained with anti-MAP2 and anti-TGF-β2. G, H, Double staining of neuronal cultures (4 d in vitro) derived from E17 cerebral cortex with anti-TGF-β2 mAb (FITC; G) and anti-MAP2 mAb (TRITC,H), Scale bar, 20 μm.
Similar articles
- Transforming growth factor-beta enhances the M-CSF and GM-CSF-stimulated proliferation of macrophages.
Celada A, Maki RA. Celada A, et al. J Immunol. 1992 Feb 15;148(4):1102-5. J Immunol. 1992. PMID: 1737928 - Stimulation of granulopoiesis by transforming growth factor beta: synergy with granulocyte/macrophage-colony-stimulating factor.
Keller JR, Jacobsen SE, Sill KT, Ellingsworth LR, Ruscetti FW. Keller JR, et al. Proc Natl Acad Sci U S A. 1991 Aug 15;88(16):7190-4. doi: 10.1073/pnas.88.16.7190. Proc Natl Acad Sci U S A. 1991. PMID: 1831268 Free PMC article. - Transforming growth factor-beta 1 in the rat brain: increase after injury and inhibition of astrocyte proliferation.
Lindholm D, Castrén E, Kiefer R, Zafra F, Thoenen H. Lindholm D, et al. J Cell Biol. 1992 Apr;117(2):395-400. doi: 10.1083/jcb.117.2.395. J Cell Biol. 1992. PMID: 1560032 Free PMC article. - Differential effects of transforming growth factor-beta2 on corneal endothelial cell proliferation-A role of serum factors.
Chen KH, Hsu WM, Lee SM. Chen KH, et al. Exp Eye Res. 2002 Jul;75(1):61-7. doi: 10.1006/exer.2002.1180. Exp Eye Res. 2002. PMID: 12123637 - TGF-beta2 in aqueous humor suppresses S-phase entry in cultured corneal endothelial cells.
Chen KH, Harris DL, Joyce NC. Chen KH, et al. Invest Ophthalmol Vis Sci. 1999 Oct;40(11):2513-9. Invest Ophthalmol Vis Sci. 1999. PMID: 10509644
Cited by
- Progression in the In Vitro Macrophage Expansion.
Wei Y, Yang J, Zu W, Wang M, Zhao Y. Wei Y, et al. J Immunol Res. 2025 Apr 28;2025:9994439. doi: 10.1155/jimr/9994439. eCollection 2025. J Immunol Res. 2025. PMID: 40331017 Free PMC article. Review. - Monocyte depletion increases local proliferation of macrophage subsets after skeletal muscle injury.
Côté CH, Bouchard P, van Rooijen N, Marsolais D, Duchesne E. Côté CH, et al. BMC Musculoskelet Disord. 2013 Dec 19;14:359. doi: 10.1186/1471-2474-14-359. BMC Musculoskelet Disord. 2013. PMID: 24354415 Free PMC article. - Increased apoptosis and inflammation after focal brain ischemia in mice lacking connexin43 in astrocytes.
Nakase T, Söhl G, Theis M, Willecke K, Naus CC. Nakase T, et al. Am J Pathol. 2004 Jun;164(6):2067-75. doi: 10.1016/S0002-9440(10)63765-0. Am J Pathol. 2004. PMID: 15161641 Free PMC article. - Newly developed TGF-β2 knock down transgenic mouse lines express TGF-β2 differently and its distribution in multiple tissues varies.
Xiyang YB, Wang F, Qian BJ, You L, Lu BT, Zhang W, Quan XZ, Ge WP, Liu S, Zhang LF, Wang TH. Xiyang YB, et al. BMC Biochem. 2013 Aug 6;14:21. doi: 10.1186/1471-2091-14-21. BMC Biochem. 2013. PMID: 23914775 Free PMC article. - Differential expression of receptor protein tyrosine phosphatases accompanies the reorganisation of the retina upon laser lesion.
Besser M, Horvat-Bröcker A, Eysel UT, Faissner A. Besser M, et al. Exp Brain Res. 2009 Sep;198(1):37-47. doi: 10.1007/s00221-009-1932-0. Epub 2009 Jul 29. Exp Brain Res. 2009. PMID: 19639307
References
- Aloisi F, Care A, Borsellino G, Gallo P, Rosa S, Bassani A, Cabibbo A, Testa U, Levi G, Peschle C. Production of hemolymphopoietic cytokines (IL-6, IL-8, colony-stimulating factors) by normal human astrocytes in response to IL-1β and tumor necrosis factor-α. J Immunol. 1992;149:2358–2366. - PubMed
- Anderson DH, Guerin CJ, Hageman GS, Pfeffer BA, Flanders KC. Distribution of transforming growth factor-β isoforms in the mammalian retina. J Neurosci Res. 1995;42:63–79. - PubMed
- Berezovskaya O, Maysinger D, Fedoroff S. The hematopoietic cytokine colony-stimulating factor in the CNS: congenital absence of CSF-1 in mice results in abnormal microglial response and increased neuron vulnerability to injury. Int J Dev Neurosci. 1995;13:285–299. - PubMed
Publication types
MeSH terms
Substances
LinkOut - more resources
Full Text Sources
Research Materials
Miscellaneous


