Identification of a somatodendritic targeting signal in the cytoplasmic domain of the transferrin receptor - PubMed (original) (raw)
Identification of a somatodendritic targeting signal in the cytoplasmic domain of the transferrin receptor
A E West et al. J Neurosci. 1997.
Abstract
Neurons are highly polarized cells that must sort proteins synthesized in the cell body for transport into the axon or the dendrites. Given the amount of time and energy needed to deliver proteins to the distal processes, neurons must have high fidelity mechanisms that ensure proper polarized protein trafficking. Although a variety of proteins are localized either to the somatodendritic domain or to the axon (), the question of whether there are signal-dependent mechanisms that sort proteins to distinct neuronal domains is only beginning to be addressed. To determine sequence requirements for the polarized sorting of transmembrane proteins into dendrites, we expressed mutant transferrin receptors in cultured rat hippocampal neurons, using a defective herpes virus vector. Wild-type human transferrin receptor colocalized with the endogenous protein in dendritic endosomes and was strictly excluded from axons, despite overexpression. Polarized targeting was abolished by deletion of cytoplasmic amino acids 7-10, 11-14, or 19-28, but not 29-42 or 43-58. These deletions also increased the appearance of transferrin receptor on the plasma membrane, implying that endocytosis and dendritic targeting are mediated by overlapping signals and similar molecular mechanisms. In addition, we have characterized a specialized para-Golgi endosome poised to play a critical role in the polarized recycling of transmembrane proteins.
Figures
Fig. 1.
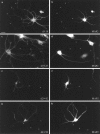
The distribution of endogenous and exogenous TfR in hippocampal neurons. Hippocampal neurons were cultured for 5–7 d before fixation (a, b and_g_, h) or infection, followed 20 hr later by fixation (c–f). b, d, f, h, The dendritic marker MAP2. a, The endogenous rat TfR in a 7 DIV neuron. c,hTfR expressed from an infected herpes virus vector.e, A deletion mutant of the hTfR missing cytoplasmic amino acids d3–59, expressed from a viral vector. g, An uninfected neuron stained with the antibody OKT9 against hTfR. The endogenous_rat TfR_ in a was present in intracellular puncta restricted to MAP2-positive dendrites and excluded from axons (axons are MAP2-negative processes marked by asterisks). Full-length human TfR expressed by viral infection (c) also was restricted to the dendrites and found in intracellular puncta despite overexpression. Deletion of the cytoplasmic domain of hTfR(e) redirected the expressed protein into the axon as well as the dendrites. The tailless mutant protein was found on the plasma membrane of both types of processes. The antibody_OKT9_ against hTfR did not stain uninfected neurons (g). Scale bar in_a_, 20 μm.
Fig. 2.
Localization of hTfR with deletions in the cytoplasmic domain. Deletions were constructed in the hTfR sequence by PCR. Deletion constructs were expressed from herpes virus vectors infected into 5–7 DIV neurons. The expressed protein was localized 20 hr after infection and compared with the dendritic marker_MAP2._ Asterisks mark the location of axons.a, c, e, g, hTfR deletion mutants. b, d, f, h, MAP2 immunoreactivity in the same neurons.a, d3–18/hTfR; c, d19–28/hTfR;e, d29–42/hTfR; g, d43–58/hTfR. Deletions from amino acids 29–42 or 43–58 in hTfR did not alter the dendritic localization of the constructs (e–h). These constructs were internalized efficiently, as indicated by the punctate intracellular pattern of the immunofluorescence. Deletion of either amino acids 3–18 or 19–28 disturbed dendritic targeting, because these constructs were seen in MAP2-negative axons (asterisks in a and c), and disturbed steady-state distribution, because the staining labeled the plasma membrane (see especially dendrites in a). Plasma membrane staining of filopodia was particularly obvious in dendrites (a). Scale bar in_a_, 20 μm.
Fig. 3.
Western blot analysis of the levels of expression for the four deletion mutants of hTfR spanning amino acids 3–58. One plate of cortical neurons (∼1.5 × 10⁶ cells) was infected for each construct with equal amounts of virus (see Materials and Methods for titers). After 24 hr the cells were homogenized, and equal amounts of protein were analyzed by Western blotting. Four twofold dilutions were loaded for each sample. The lowest dilution is on the left. A fluorogram with signals in the linear range of the film was scanned on a densitometer to quantify the levels of expression. a, The film of the twofold dilutions for each construct. b, Results of the densitometer quantification. All four constructs showed approximately equal levels of expression, although d3–18 was expressed at slightly higher levels than the others. All four dilutions were visible for d3–18 in the fluorogram, whereas only three were visible for the other constructs. Quantified,d3–18 was expressed at only approximately threefold greater levels than d19–28 and at only ∼1.5-fold above d29–42 or d43–58.
Fig. 4.
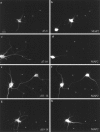
Localization of hTfRs containing a four amino acid deletion in the region 3–18. Deletion mutants of hTfR were built by PCR to contain one of the following four amino acid deletions:d3–6, d7–10, d11–14, and d15–18. Constructs were expressed in 5–7 DIV cultured hippocampal neurons and localized by immunofluorescence 20 hr later. Dendrites are indicated by_MAP2_ in b, d, f, and g. Axons are marked with asterisks. a, d3–6/hTfR; c, d7–10/hTfR; e, d11–14/hTfR; g, d15–18/hTfR. Deletions of amino acids 3–6 or 15–18 had no effect on the dendritic localization or internalization of the transferrin receptor. Deletions from 7–10 or 11–14 caused the constructs to appear in axons as well as dendrites, and the protein was easily detectable on the plasma membrane (note the prominent filopodial staining associated with dendrites in_c_ and e). Scale bar in a, 20 μm.
Fig. 5.
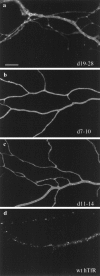
Plasma membrane staining for hTfR deletion mutants 19–28, 7–10, and 11–14. Neurons 5–7 DIV were infected with deletion mutants of hTfR and fixed 20 hr later for immunostaining with OKT9 antibody against hTfR. Cells were photographed at 63×, and the prints were enlarged to demonstrate staining of the plasma membrane. a, d19–28; b, d7–10; c, d11–14; d, wild-type hTfR (wthTfR). All three mutant constructs showed a similar pattern of immunofluorescence with some intracellular puncta, but the majority of the staining was present on the surface of the processes. The punctate pattern of the wild-type protein is included in_d_ for comparison. Scale bar in a, 5 μm.
Fig. 6.
Recycling endosomes in neurons labeled by uptake of fluorescent Tf. Coverslips of neurons at 9–13 DIV were placed face up in 12-well dishes and washed twice with prewarmed HEPES-buffered solution. a, The cells were fed 25 μg/ml Cy3-Tf for 20 min at 37°C in HEPES-buffered solution. b,c, C6-NBD-ceramide (5 μ
m
) bound to BSA was added to the medium for 10 min. Cy3-Tf at 25 μg/ml was included in the first two 10 min washes and then removed for 10 min in the final wash. d, e, Fluorescein-conjugated Tf was added to the medium for 60 min and removed for 10 min, and then DiI–LDL was added to the medium for 5 min. All cells were washed twice with ice-cold HEPES-buffered solution before fixing. The numbers on the pictures indicate the time of label/chase. a, Twenty minutes; Tf uptake. Bright puncta and tubules were seen throughout the cell body and to the very tips of the dendrites. b, Twenty minutes; Tf uptake with a 10 min chase. The total label was less than in a, indicating that some TfR had recycled to the surface. A bright accumulation of Tf near the upper part_of the left border of the nucleus was visible. Some label remained in the dendrites. c, C6-NBD-ceramide label of the TGN. Bright labeling was visible along the left side of the nucleus, but the brightest label was concentrated near the lower border of the cell, distinct from the brightest regions labeled by Tf in b. d, Sixty minutes; Tf labeling with a 15 min chase. The accumulation of Tf next to the nucleus in the cell body was enhanced. e, Five minute pulse of DiI–LDL. The brightest staining was located on the edges of the peripheral dendrites. Little staining was visible in the cell body. In this focal plane the patterns of labeling in_d and e were essentially complementary. Scale bars: in a, 20 μm for a,d, and e; in b, 20 μm for b and c.
Similar articles
- Polarized targeting of DNER into dendritic plasma membrane in hippocampal neurons depends on endocytosis.
Kurisu J, Fukuda T, Yokoyama S, Hirano T, Kengaku M. Kurisu J, et al. J Neurochem. 2010 Jun;113(6):1598-610. doi: 10.1111/j.1471-4159.2010.06714.x. Epub 2010 Mar 29. J Neurochem. 2010. PMID: 20367751 - Synaptic vesicle proteins and early endosomes in cultured hippocampal neurons: differential effects of Brefeldin A in axon and dendrites.
Mundigl O, Matteoli M, Daniell L, Thomas-Reetz A, Metcalf A, Jahn R, De Camilli P. Mundigl O, et al. J Cell Biol. 1993 Sep;122(6):1207-21. doi: 10.1083/jcb.122.6.1207. J Cell Biol. 1993. PMID: 8376458 Free PMC article. - Targeting of the synaptic vesicle protein synaptobrevin in the axon of cultured hippocampal neurons: evidence for two distinct sorting steps.
West AE, Neve RL, Buckley KM. West AE, et al. J Cell Biol. 1997 Nov 17;139(4):917-27. doi: 10.1083/jcb.139.4.917. J Cell Biol. 1997. PMID: 9362510 Free PMC article. - Mechanisms of polarized membrane trafficking in neurons -- focusing in on endosomes.
Lasiecka ZM, Winckler B. Lasiecka ZM, et al. Mol Cell Neurosci. 2011 Dec;48(4):278-87. doi: 10.1016/j.mcn.2011.06.013. Epub 2011 Jul 2. Mol Cell Neurosci. 2011. PMID: 21762782 Free PMC article. Review. - Endocytosis and endosomes at the crossroads of regulating trafficking of axon outgrowth-modifying receptors.
Winckler B, Yap CC. Winckler B, et al. Traffic. 2011 Sep;12(9):1099-108. doi: 10.1111/j.1600-0854.2011.01213.x. Epub 2011 May 23. Traffic. 2011. PMID: 21535338 Free PMC article. Review.
Cited by
- Targeted trafficking of neurotransmitter receptors to synaptic sites.
Marchand S, Cartaud J. Marchand S, et al. Mol Neurobiol. 2002 Aug;26(1):117-35. doi: 10.1385/MN:26:1:117. Mol Neurobiol. 2002. PMID: 12392061 Review. - Signal-mediated, AP-1/clathrin-dependent sorting of transmembrane receptors to the somatodendritic domain of hippocampal neurons.
Farías GG, Cuitino L, Guo X, Ren X, Jarnik M, Mattera R, Bonifacino JS. Farías GG, et al. Neuron. 2012 Sep 6;75(5):810-23. doi: 10.1016/j.neuron.2012.07.007. Neuron. 2012. PMID: 22958822 Free PMC article. - PIN-G--a novel reporter for imaging and defining the effects of trafficking signals in membrane proteins.
McKeown L, Robinson P, Greenwood SM, Hu W, Jones OT. McKeown L, et al. BMC Biotechnol. 2006 Mar 8;6:15. doi: 10.1186/1472-6750-6-15. BMC Biotechnol. 2006. PMID: 16524465 Free PMC article. - Routing of membrane proteins to large dense core vesicles in PC12 cells.
Marx R, Mains RE. Marx R, et al. J Mol Neurosci. 2002 Feb-Apr;18(1-2):113-27. doi: 10.1385/jmn🔞1-2:111. J Mol Neurosci. 2002. PMID: 11931341 - Spatial control of membrane traffic in neuronal dendrites.
Radler MR, Suber A, Spiliotis ET. Radler MR, et al. Mol Cell Neurosci. 2020 Jun;105:103492. doi: 10.1016/j.mcn.2020.103492. Epub 2020 Apr 12. Mol Cell Neurosci. 2020. PMID: 32294508 Free PMC article. Review.
References
- Ali SA, Steinkasserer A. PCR ligation–PCR mutagenesis: a protocol for creating gene fusions and mutations. Biotechniques. 1995;18:746–749. - PubMed
- Banker GA, Cowan WM. Rat hippocampal neurons in dispersed cell culture. Brain Res. 1977;126:397–425. - PubMed
- Caceres A, Banker G, Steward O, Binder L, Payne M. MAP2 is localized to the dendrites of hippocampal neurons which develop in culture. Dev Brain Res. 1984;13:314–318. - PubMed
Publication types
MeSH terms
Substances
LinkOut - more resources
Full Text Sources
Other Literature Sources


