The mouse pale ear (ep) mutation is the homologue of human Hermansky-Pudlak syndrome - PubMed (original) (raw)
. 1997 Aug 19;94(17):9238-43.
doi: 10.1073/pnas.94.17.9238.
S C Wildenberg, N M Keiper, E K Novak, M E Rusiniak, R T Swank, N Puri, J N Finger, N Hagiwara, A L Lehman, T L Gales, M E Bayer, R A King, M H Brilliant
Affiliations
- PMID: 9256466
- PMCID: PMC23134
- DOI: 10.1073/pnas.94.17.9238
The mouse pale ear (ep) mutation is the homologue of human Hermansky-Pudlak syndrome
J M Gardner et al. Proc Natl Acad Sci U S A. 1997.
Abstract
The recessive mutation at the pale ear (ep) locus on mouse chromosome 19 was found to be the homologue of human Hermansky-Pudlak syndrome (HPS). A positional cloning strategy using yeast artificial chromosomes spanning the HPS locus was used to identify the HPS gene and its murine counterpart. These genes and their predicted proteins are highly conserved at the nucleotide and amino acid levels. Sequence analysis of the mutant ep gene revealed the insertion of an intracisternal A particle element in a protein-coding 3' exon. Here we demonstrate that mice with the ep mutation exhibit abnormalities similar to human HPS patients in melanosomes and platelet-dense granules. These results establish an animal model of HPS and will facilitate biochemical and molecular analyses of the functions of this protein in the membranes of specialized intracellular organelles.
Figures
Figure 1
Homology between mouse distal chromosome 19 and human chromosome 10q2. The upper portion shows the location of the ep locus relative to other markers in our backcross (see Materials and Methods). No recombination was detected between ep and 7RV-H, a human unique sequence fragment found in YAC 811d8 that spanned the HPS region on Chromosome 10q2 (shown at Bottom).
Figure 2
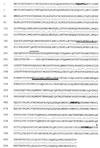
The amino acid sequences encoded by the mouse ep (MEP-1, accession no. U97149, top row) and human HPS (10, accession no. U65676, bottom row) genes. Vertical bars between the sequences indicate identity. Similarity is indicated by dots between the sequences, with two dots indicating a higher degree of amino acid similarity and less evolutionary distance than one dot. Dashes indicate nonconservation or gaps. Key features of the mouse sequence are indicated as follows: single underline, helix–loop–helix motif; overline, polyglutamic acid motif; double underline, transmembrane domain; asterisk, point of IAP element insertion; and bold, lysosome/endosome trafficking motif [(D or E)-X-X-X-X-L-L; ref. 41]. Amino acid homologies depicted represent analysis by the
gap
program of the GCG sequence analysis software (Wisconsin Package). Protein subsequence analysis and hydropathy plots were performed with the MacVector sequence analysis program (International Biotechnologies). Transmembrane domain assignments were determined with a window size of 20 and the Goldman, Engelman, and Steitz hydrophilicity scales (40).
Figure 3
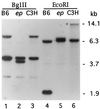
Southern blot analysis of genomic DNA from: C57BL/6J +/+ (B6); C57BL/6J ep/ep congenic (ep); and C3H/HeJ +/+ (C3H) digested with _Bgl_II and _Eco_RI. The blots were hybridized with a 1.2-kb _Sca_I fragment derived from the MEP-2 cDNA. Selected size markers at right indicate the position of lambda DNA fragments digested with _Bst_EII. Note the presence of exon-bearing fragments of altered size in ep DNA (_Bgl_II: ≈4.0 kb; _Eco_RI: ≈9.0 kb) shown in lanes 2 and 5, respectively. The variation seen in the sizes of _Eco_RI-digested DNA between wild-type C57BL/6J and C3H/HeJ represents a restriction fragment length polymorphism. The position of marker fragments (in kilobases) is shown on the right.
Figure 4
Consequences of the ep IAP insertion. (A) DNA sequence of the IAP chromosomal insertion point. Six base pairs of mouse genomic target DNA (underlined) are duplicated at the site of the IAP element insertion within a 3′ exon. The IAP element depiction has black boxes representing long terminal repeat sequences, portions of which are shown above. Sequence of the larger genomic region (not shown; accession nos. AF003868 and AF004352) indicate that the ep gene and the IAP element are in opposite transcriptional orientations. (B) Predicted C-terminal amino acid sequences from ep and wild type. The sequence of the C terminal region of the wild-type ep protein is shown on the top line; the dark arrow marks the junction between the two adjacent exons shown above in A, and the open arrow indicates the beginning of the ORF predicted by IAP sequences. The sequence of the mutant ep protein is shown on the bottom lines. The amino acid sequences shown were deduced from the nucleotide sequences of the 3′ RACE products from wild type (accession no. AF003866) and ep (accession no. AF003867).
Figure 5
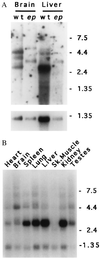
Expression of the ep gene. (A) Northern blot of poly(A)+ RNAs (6 μg) isolated from brain or liver of homozygous wild-type (wt) or homozygous ep (ep) and hybridized with a 0.75-kb _Sma_I fragment of cDNA MEP-1 (Upper), or control probe from Gapd cDNA (Lower). Note the apparent size increase in all forms of the ep transcript compared with those observed in wild-type brain and liver RNA. (B) Mouse multiple tissue Northern blot (CLONTECH). Lanes: 1, 2 μg of poly(A)+ RNA from wild-type heart; 2, brain; 3, spleen; 4, lung; 5, liver; 6, skeletal muscle; 7, kidney; and 8, testes hybridized with a 0.75-kb _Sma_I fragment of cDNA MEP-1. Control hybridization to β-actin (not shown) confirmed the integrity and equal loading of all RNAs. For A and B, the sizes of marker RNAs are shown to the right in kilobases.
Figure 6
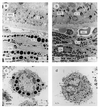
Ultrastructure of eye tissue and cultured skin melanocytes from C57BL/6J +/+ and C57BL/6J ep/ep congenic mice. (Upper) Sections through (a) ep/ep and (b) +/+ eyes showing the pigmented retinal epithelium (RPE). Ch, choroid; RBC, red blood cells; and M, melanosomes (Lower) Cultured skin melanocytes from (c) ep/ep and (d) +/+ mice. Large melanosomes (macromelanosomes) are seen in the choroid and cultured melanocytes from ep/ep mice, which may be derived from fusions of smaller vesicles. Retinal melanocytes from ep/ep exhibit smaller melanosomes than their wild-type controls and are more unevenly pigmented. All panels are shown at the same magnification. (Bar = 2 μm.)
Figure 7
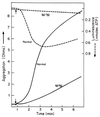
Collagen-mediated aggregation of mutant pale ear (ep/ep) and normal (ep/+) platelets and release of ATP. Platelet aggregation was determined in whole blood by the impedance method in response to 1 μg/ml collagen. Release of ATP was determined simultaneously by luminescence methods. The small arrow indicates the time of addition of collagen.
Similar articles
- Mouse pale ear (ep) is homologous to human Hermansky-Pudlak syndrome and contains a rare 'AT-AC' intron.
Feng GH, Bailin T, Oh J, Spritz RA. Feng GH, et al. Hum Mol Genet. 1997 May;6(5):793-7. doi: 10.1093/hmg/6.5.793. Hum Mol Genet. 1997. PMID: 9158155 - Hermansky-Pudlak syndrome: models for intracellular vesicle formation.
Shotelersuk V, Gahl WA. Shotelersuk V, et al. Mol Genet Metab. 1998 Oct;65(2):85-96. doi: 10.1006/mgme.1998.2729. Mol Genet Metab. 1998. PMID: 9787100 Review. - Hermansky-Pudlak syndrome and pale ear: melanosome-making for the millennium.
Spritz RA. Spritz RA. Pigment Cell Res. 2000 Feb;13(1):15-20. doi: 10.1034/j.1600-0749.2000.130104.x. Pigment Cell Res. 2000. PMID: 10761991 Review. - Hermansky-Pudlak syndrome is caused by mutations in HPS4, the human homolog of the mouse light-ear gene.
Suzuki T, Li W, Zhang Q, Karim A, Novak EK, Sviderskaya EV, Hill SP, Bennett DC, Levin AV, Nieuwenhuis HK, Fong CT, Castellan C, Miterski B, Swank RT, Spritz RA. Suzuki T, et al. Nat Genet. 2002 Mar;30(3):321-4. doi: 10.1038/ng835. Epub 2002 Feb 11. Nat Genet. 2002. PMID: 11836498 - Characterization of the murine gene corresponding to human Hermansky-Pudlak syndrome type 3: exclusion of the Subtle gray (sut) locus.
Huizing M, Anikster Y, White JG, Gahl WA. Huizing M, et al. Mol Genet Metab. 2001 Sep-Oct;74(1-2):217-25. doi: 10.1006/mgme.2001.3233. Mol Genet Metab. 2001. PMID: 11592818
Cited by
- Retrotransposon-derived elements in the mammalian genome: a potential source of disease.
Druker R, Whitelaw E. Druker R, et al. J Inherit Metab Dis. 2004;27(3):319-30. doi: 10.1023/B:BOLI.0000031096.81518.66. J Inherit Metab Dis. 2004. PMID: 15190191 Review. - Plasma lipidomic profiling in murine mutants of Hermansky-Pudlak syndrome reveals differential changes in pro- and anti-atherosclerotic lipids.
Ma J, Wang R, Lam SM, Zhang C, Shui G, Li W. Ma J, et al. Biosci Rep. 2019 Feb 19;39(2):BSR20182339. doi: 10.1042/BSR20182339. Print 2019 Feb 28. Biosci Rep. 2019. PMID: 30710063 Free PMC article. - Mechanisms of protein delivery to melanosomes in pigment cells.
Sitaram A, Marks MS. Sitaram A, et al. Physiology (Bethesda). 2012 Apr;27(2):85-99. doi: 10.1152/physiol.00043.2011. Physiology (Bethesda). 2012. PMID: 22505665 Free PMC article. Review. - Melanoregulin, product of the dsu locus, links the BLOC-pathway and OA1 in organelle biogenesis.
Rachel RA, Nagashima K, O'Sullivan TN, Frost LS, Stefano FP, Marigo V, Boesze-Battaglia K. Rachel RA, et al. PLoS One. 2012;7(9):e42446. doi: 10.1371/journal.pone.0042446. Epub 2012 Sep 11. PLoS One. 2012. PMID: 22984402 Free PMC article. - Characterizing renal involvement in Hermansky-Pudlak Syndrome in a zebrafish model.
Schenk H, Müller-Deile J, Schroder P, Bolaños-Palmieri P, Beverly-Staggs L, White R, Bräsen JH, Haller H, Schiffer M. Schenk H, et al. Sci Rep. 2019 Nov 27;9(1):17718. doi: 10.1038/s41598-019-54058-5. Sci Rep. 2019. PMID: 31776394 Free PMC article.
References
- Hermansky F, Pudlak P. Blood. 1959;14:162–169. - PubMed
- Summers C G, Knobloch W H, Witkop C J, King R A. Ophthalmology. 1988;95:545–554. - PubMed
- King R A, Hearing V J, Oetting W S. In: The Metabolic and Molecular Bases of Inherited Disease, Seventh Edition. Scriver C R, Beaudet A L, Sly W S, Valle D, editors. New York: McGraw–Hill; 1994. pp. 4353–4392.
- Bithell T C. In: Wintrobe’s Clinical Hematology. 9th Ed. Lee G R, Bithell T C, Foerster J, Athens J W, Lukens J N, editors. Philadelphia: Lea & Febiger; 1993. pp. 1397–1421.
- Weiss H J. In: Hemostasis and Thrombosis: Basic Principles and Clinical Practice. 3rd Ed. Colman R W, Hirsh J, Marder V J, Salzman E W, editors. Philadelphia: Lippincott; 1994. pp. 673–684.
Publication types
MeSH terms
Grants and funding
- GM22167/GM/NIGMS NIH HHS/United States
- R01 HL031698/HL/NHLBI NIH HHS/United States
- CA09035/CA/NCI NIH HHS/United States
- GM/AR56181/GM/NIGMS NIH HHS/United States
- P30 CA006927/CA/NCI NIH HHS/United States
- T32 CA009035/CA/NCI NIH HHS/United States
LinkOut - more resources
Full Text Sources
Other Literature Sources
Molecular Biology Databases

