A quantitative description of short-term plasticity at excitatory synapses in layer 2/3 of rat primary visual cortex - PubMed (original) (raw)
A quantitative description of short-term plasticity at excitatory synapses in layer 2/3 of rat primary visual cortex
J A Varela et al. J Neurosci. 1997.
Abstract
Cortical synapses exhibit several forms of short-term plasticity, but the contribution of this plasticity to visual response dynamics is unknown. In part, this is because the simple patterns of stimulation used to probe plasticity in vitro do not correspond to patterns of activity that occur in vivo. We have developed a method of quantitatively characterizing short-term plasticity at cortical synapses that permits prediction of responses to arbitrary patterns of stimulation. Synaptic responses were recorded intracellularly as EPSCs and extracellularly as local field potentials in layer 2/3 of rat primary visual cortical slices during stimulation of layer 4 with trains of electrical stimuli containing random mixtures of frequencies. Responses exhibited complex dynamics that were well described by a simple three-component model consisting of facilitation and two forms of depression, a stronger form that decayed exponentially with a time constant of several hundred milliseconds and a weaker, but more persistent, form that decayed with a time constant of several seconds. Parameters obtained from fits to one train were used to predict accurately responses to other random and constant frequency trains. Control experiments revealed that depression was not caused by a decrease in the effectiveness of extracellular stimulation or by a buildup of inhibition. Pharmacological manipulations of transmitter release and postsynaptic sensitivity suggested that both forms of depression are mediated presynaptically. These results indicate that firing evoked by visual stimuli is likely to cause significant depression at cortical synapses. Hence synaptic depression may be an important determinant of the temporal features of visual cortical responses.
Figures
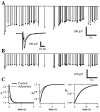
Fig. 2.
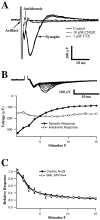
Characterization of field potential components.A, Responses to single stimuli recorded under control conditions, after application of 10 μ
m
CNQX, and after application of 1 μ
m
TTX. Three traces for each condition are shown. A presumed antidromic response (initial negative deflection after the stimulus artifact) is blocked by application of TTX but persists during application of CNQX. The synaptic response is abolished by either CNQX or TTX. B, Amplitudes of antidromic and synaptic response components during a 20 Hz constant frequency train. Error bars are SDs over five repetitions.Top traces are superimposed average responses to each stimulus in the train. Depression is apparent in the synaptic but not in the antidromic response. C, Depression of isolated AMPA responses during 20 Hz stimulation. GABAA- and NMDA-dependent responses were blocked by application of BMI (20 μ
m
) and MK-801 (2 μ
m
). Plotted_points_ are the mean responses (error bars indicate SD over 5 repetitions) normalized to the initial response in each experiment and averaged across separate experiments (n = 4, AMPA only; n = 28, control).
Fig. 3.
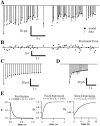
Measured and predicted short-term plasticity of EPSCs. A, Average amplitudes (lines; n = 10 repetitions) of EPSCs recorded in a layer 2/3 pyramidal neuron in response to low-amplitude stimulation of layer 4. Stimulus train was Poisson-distributed with a mean rate of 4 Hz. Dots are the best fit of a three-component model. B, The fraction of each measured response amplitude by which the model prediction differed from the data. C, D, Measured (lines) and predicted (dots) responses to constant frequency trains at 5 Hz (C) and 10 Hz (D). These predictions were generated from the fit of the model to the response to the Poisson-distributed train in_A_. E, Parameters of the best fit of the model. Each stimulus caused facilitation (F), a stronger but more rapidly recovering form of depression (_D_1), and a weaker but more persistent form of depression (_D_2). _Curves_illustrate the amplitude and time course of facilitation and both forms of depression that would follow an isolated stimulus. The intercepts of each curve with the _y_-axis indicate the initial magnitude of the facilitation and depression (see Eqs. 7-10). Between stimuli, facilitation and depression factors decayed toward 1 with first-order kinetics (time constants indicated).
Fig. 4.
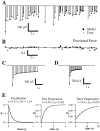
Measured and predicted short-term plasticity of field potentials. Conventions are described in Figure 3.A, Average amplitudes (lines;n = 5 repetitions) of field potentials recorded in layer 2/3 in response to Poisson-distributed stimulus train (mean, 4 Hz) of layer 4 and the best fit of three-component model (dots). B, The fraction of each measured response amplitude by which the fit of the model differs from the data. The average error of 0.7 ± 1.0% was not significantly different from zero. The fit accounts for >97% of the variation in the amplitude of the data. C, D, Measured (lines) and predicted (dots) responses to constant frequency trains at 5 Hz (C) and 10 Hz (D). E, Parameters of the best fit of the model.
Fig. 8.
Sensitivity of fit errors to variation in parameters. Field potential responses recorded during a Poisson-distributed train (mean rate, 4 Hz) were fit with a three-component model. A, B, Individual parameters were varied about the best fit values one at a time and plotted against the resulting rms error. For each parameter, the range of values shown is that producing rms errors of up to 10%. A greater range was tested. C, D, Pairs of parameters were varied simultaneously over ranges of values that produced increases in the rms error of ≤10% above optimal (i.e., from 5.2 to 15.2%). The resulting error surface is shaded such that white indicates the region of lowest error,black indicates regions of highest error, and_grays_ indicate regions of intermediate error. Adjacent regions represent rms error increases of 1%.
Fig. 10.
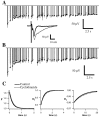
Partial postsynaptic blockade with CNQX does not alter short-term plasticity. Conventions are described in Figure 3. Measured field potential responses (lines) and best fit of the model (dots) are given before (A) and after (B) application of 0.5 μ
m
CNQX. Inset, Average responses to the first stimulus in the train under both conditions. Note that responses in A and B show similar overall depression and seem to be essentially scaled versions of one another. C, Parameters of the fit are extremely similar. Control and CNQX time constants are 113 and 114 msec for_F_, 640 and 631 msec for_D_1, and 5723 and 5723 msec for_D_2, respectively.
Fig. 11.
Blockade of AMPA receptor desensitization with cyclothiazide does not alter short-term plasticity. Conventions are described in Figure 3. Measured field potential responses (lines) and best fit of the model (dots) are given before (A) and after (B) application of cyclothiazide.Inset, Average responses to the first stimulus in the train under both conditions. Note that although cyclothiazide clearly prolonged the duration and slightly increased the amplitude of individual responses (inset), there was little effect on the buildup of depression. C, Parameters of the fit are extremely similar. Control and cyclothiazide time constants are 242 and 252 msec for F, 508 and 648 msec for_D_1, and 7523 and 9208 msec for_D_2, respectively.
Fig. 12.
Low calcium dramatically reduces synaptic depression. Conventions are described in Figure 3. Measured field potential responses (lines) and best fit of the model (dots) are given before (A) and after (B) exchange of normal extracellular solution for a solution containing 0.5 m
m
Ca2+ and 3.5 m
m
Mg2+.Inset, Average responses to the first stimulus in the train under both conditions. Note that responses in B do not show the overall depression apparent in A and that the rapid depression apparent during high-frequency portions of_A_ (arrow) are replaced by net facilitation in_B_. C, Parameters of the fit. Facilitation (left) is mildly reduced (initial amplitude, 1 +f, changed from 3.03 to 2.45) but increased in duration (time constants changed from 93 to 124 msec). In contrast, the amplitude of both depression components (middle and_right_) are substantially reduced (i.e., are closer to 1;_D_1, 0.368–0.955;_D_2, 0.983–0.991). Time constants changed from 438 to 569 msec (_D_1) and from 7523 to 4283 msec (_D_2).
Fig. 13.
Adenosine reduces synaptic depression. Conventions are described in Figure 3. Measured field potential responses (lines) and best fit of the model (dots) are given before (A) and after (B) bath application of 10 μ
m
adenosine. Inset, Average responses to the first stimulus in the train under both conditions. Note that responses in_B_ show much less overall depression than is apparent in_A_ and that high-frequency portions of A_are associated with rapid depression, whereas the same portions in_B show constant amplitude or mild facilitation.C, Parameters of the fit. Facilitation (left) was moderately reduced (amplitude changed from 2.63 to 1.65; time constants changed from 106 to 168 msec). The more rapid component of the depression (_D_1; middle) was also moderately reduced (amplitude changed from 0.526 to 0.763; time constants changed from 446 to 566 msec). The longer-lasting component of the depression (_D_2;right) was abolished (initial amplitude was 0.98, and time constant was 5723 msec; during adenosine application, amplitude was 1.0).
Fig. 7.
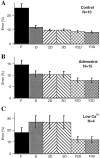
Comparison of one-, two-, three-, and four-component models. fEPSP responses to 4 Hz Poisson-distributed trains recorded under control conditions (A), during application of 5–20 μ
m
adenosine (B), and during perfusion with reduced extracellular calcium (C) were fit with six different related models of short-term plasticity (see Eqs. 1-6). Each model had one to four components, consisting of zero or one facilitation factor (indicated by F under_bar_) and zero to three depression factors (indicated by_D_ under bar). Facilitation and depression factors were those in Eqs. 1-6. Error bars indicate the SEM of the fit error associated with each model.
Fig. 9.
Distribution of fit parameters. Data recorded intracellularly (open circles) and extracellularly (filled circles) were fit with a two-component model (see Eq. 4). Fit parameters are shown as a function of animal age. Recovery time constants tended to be longer in data from younger animals.
Fig. 1.
Synaptic depression recorded in layer 2/3 during random stimulation of layer 4. A,B, EPSCs recorded during whole-cell voltage clamp of a visually identified pyramidal neuron. Stimulus was a Poisson-distributed train (duration, 20 sec; mean rate, 4 Hz).A, Superimposed individual responses to the first stimulus in the train (top; n = 8 repetitions) and superimposed responses to each stimulus in the train averaged over the eight repetitions (bottom).B, Averaged responses to the entire train.C, D, Field potentials recorded in layer 2/3 in response to the same stimulus pattern during a separate experiment. C, Superimposed individual responses to the first stimulus in each of five repetitions (top) and superimposed averaged responses to each stimulus in the train (bottom). D, Averaged responses to the entire train.
Fig. 5.
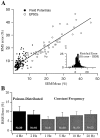
Accuracy of fits and predictions depend on response variability. Responses were fit with the four-component model (see Fig. 7). For each cell and recording site, the model was fit to data from a subset of stimulus trains tested and then used to predict responses to other trains. A, The rms errors of model fits and predictions plotted against the SEM of the data (also expressed as a percent of the mean) over the 5–10 repetitions recorded. Filled circles are field potentials (n = 140 response trains from 39 slices).Open circles are EPSCs (n = 42 response trains from 11 cells). The line is the best linear fit (slope = 0.85; intercept = 4.7%;r = 0.90). Note that EPSCs had higher fit errors but also had correspondingly higher SEMs. Inset, Histogram of differences between the normalized fit errors and SEMs.B, Comparisons of rms errors for field potential responses to different types of stimulus trains. Black bars are Poisson-distributed trains, and gray bars are constant frequency trains. For each data set, model parameters were obtained from fits to responses during 4 Hz Poisson-distributed trains or from jointly fitting these responses and those obtained during stimulation with a 20 Hz constant frequency train. Responses to other trains were then predicted using the same fit parameters. The errors for the fits (4 Hz Poisson-distributed and 20 Hz constant frequency) and predictions (2 Hz Poisson-distributed and 1–10 Hz constant frequency) are quite similar.
Fig. 6.
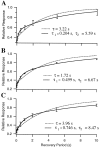
Recovery from depression after a constant frequency train has two time constants. Field potential responses to single test stimuli are given after a 15-sec-long 20 Hz train. Recovery intervals ranged from 10 msec to 10 sec. Response amplitudes are normalized to the initial responses. Error bars indicate SDs over five repetitions. Data from three different slices are shown (A–C). In each case data were well fit by the product of two exponentials (solid curves) but were not as well fit by a single exponential (dotted curves).
Fig. 14.
Effects of pharmacological manipulations on responses to 20 Hz trains. A–F, Responses were recorded before (solid lines, filled circles) and after (dashed lines, open circles) manipulations. Response amplitudes are normalized to the initial response in each train to allow comparison of effects on short-term plasticity independently of effects on response amplitude. Error bars indicate SD across repetitions within an experiment, averaged across the number of experiments shown. Note that reducing postsynaptic responses with 0.25 μ
m
CNQX (A) or reducing AMPA receptor desensitization with 60 μ
m
CTZ (B) did not alter depression during 20 Hz stimulation. In contrast, manipulations known to alter transmitter release (C–F) produced dramatic changes in short-term plasticity. G. Effects of manipulations on initial response amplitude. Amplitudes have been normalized to initial control response amplitudes (first bar).
Similar articles
- Multiple forms of short-term plasticity at excitatory synapses in rat medial prefrontal cortex.
Hempel CM, Hartman KH, Wang XJ, Turrigiano GG, Nelson SB. Hempel CM, et al. J Neurophysiol. 2000 May;83(5):3031-41. doi: 10.1152/jn.2000.83.5.3031. J Neurophysiol. 2000. PMID: 10805698 - Adaptation at synaptic connections to layer 2/3 pyramidal cells in rat visual cortex.
Beck O, Chistiakova M, Obermayer K, Volgushev M. Beck O, et al. J Neurophysiol. 2005 Jul;94(1):363-76. doi: 10.1152/jn.01287.2004. Epub 2005 Mar 9. J Neurophysiol. 2005. PMID: 15758049 - Two forms of synaptic plasticity with distinct dependence on age, experience, and NMDA receptor subtype in rat visual cortex.
Yoshimura Y, Ohmura T, Komatsu Y. Yoshimura Y, et al. J Neurosci. 2003 Jul 23;23(16):6557-66. doi: 10.1523/JNEUROSCI.23-16-06557.2003. J Neurosci. 2003. PMID: 12878697 Free PMC article. - Role of Ca(2+) channels in short-term synaptic plasticity.
Xu J, He L, Wu LG. Xu J, et al. Curr Opin Neurobiol. 2007 Jun;17(3):352-9. doi: 10.1016/j.conb.2007.04.005. Epub 2007 Apr 26. Curr Opin Neurobiol. 2007. PMID: 17466513 Review. - Advances in understanding visual cortex plasticity.
McCoy PA, Huang HS, Philpot BD. McCoy PA, et al. Curr Opin Neurobiol. 2009 Jun;19(3):298-304. doi: 10.1016/j.conb.2009.05.010. Epub 2009 Jun 18. Curr Opin Neurobiol. 2009. PMID: 19540104 Free PMC article. Review.
Cited by
- A computational investigation of feedforward and feedback processing in metacontrast backward masking.
Silverstein DN. Silverstein DN. Front Psychol. 2015 Feb 24;6:6. doi: 10.3389/fpsyg.2015.00006. eCollection 2015. Front Psychol. 2015. PMID: 25759672 Free PMC article. - Short-term presynaptic plasticity.
Regehr WG. Regehr WG. Cold Spring Harb Perspect Biol. 2012 Jul 1;4(7):a005702. doi: 10.1101/cshperspect.a005702. Cold Spring Harb Perspect Biol. 2012. PMID: 22751149 Free PMC article. Review. - Sleep maintains excitatory synapse diversity in the cortex and hippocampus.
Koukaroudi D, Qiu Z, Fransén E, Gokhale R, Bulovaite E, Komiyama NH, Seibt J, Grant SGN. Koukaroudi D, et al. Curr Biol. 2024 Aug 19;34(16):3836-3843.e5. doi: 10.1016/j.cub.2024.07.032. Epub 2024 Aug 2. Curr Biol. 2024. PMID: 39096907 Free PMC article. - Retrograde regulation of GABA transmission by the tonic release of oxytocin and endocannabinoids governs postsynaptic firing.
Oliet SH, Baimoukhametova DV, Piet R, Bains JS. Oliet SH, et al. J Neurosci. 2007 Feb 7;27(6):1325-33. doi: 10.1523/JNEUROSCI.2676-06.2007. J Neurosci. 2007. PMID: 17287507 Free PMC article. - Frequency-dependent PSP depression contributes to low-pass temporal filtering in Eigenmannia.
Rose GJ, Fortune ES. Rose GJ, et al. J Neurosci. 1999 Sep 1;19(17):7629-39. doi: 10.1523/JNEUROSCI.19-17-07629.1999. J Neurosci. 1999. PMID: 10460268 Free PMC article.
References
- Abbott LF, Sen K, Varela JA, Nelson SB. Synaptic depression and cortical gain control. Science. 1997;275:220–222. - PubMed
- Bode-Greuel KM, Singer W, Aldenhoff JB. A current source density analysis of field potentials evoked in slices of visual cortex. Exp Brain Res. 1987;69:213–219. - PubMed
- Bonds AB. Temporal dynamics of contrast gain in single cells of the cat striate cortex. Vis Neurosci. 1991;6:239–255. - PubMed
- Carandini M, Ferster D. Visual adaptation hyperpolarizes cells of the cat striate cortex. Science. 1997;276:949. - PubMed
Publication types
MeSH terms
Substances
LinkOut - more resources
Full Text Sources
Molecular Biology Databases
