Coupling of cell division to cell growth by translational control of the G1 cyclin CLN3 in yeast - PubMed (original) (raw)
Coupling of cell division to cell growth by translational control of the G1 cyclin CLN3 in yeast
M Polymenis et al. Genes Dev. 1997.
Abstract
The eukaryotic cell cycle is driven by a cascade of cyclins and kinase partners including the G1 cyclin Cln3p in yeast. As the first step in this cascade, Cln3p is uniquely positioned to determine the critical growth-rate threshold for division. To analyze factors regulating CLN3 expression, we identified a short upstream open reading frame (uORF) in the 5' leader of CLN3 mRNA as a translational control element. This control element is critical for the growth-dependent regulation of Cln3p synthesis because it specifically represses CLN3 expression during conditions of diminished protein synthesis or slow growth. Inactivation of the uORF accelerates the completion of Start and entry into the cell cycle suggesting that translational regulation of CLN3 provides a mechanism coupling cell growth and division.
Figures
Figure 1
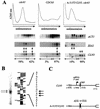
Inhibition of the protein synthesis machinery influences the translational efficiency of the CLN3 message, caused by the presence of a short uORF. (A) Initiation of translation of particular mRNAs was evaluated by fractionating polysomes on sucrose gradients followed by RNA hybridization to identify fractions containing specific mRNAs. RNA harvested from polysomal profiles of cdc63, CDC63, and A-315T/CLN3, cdc63 cells was monitored at 260 nm. Arrows indicate the position of CLN3 and SSA2 transcripts. The percentage of CLN3 message found in light and heavy polysomal fractions, determined by densitometry, is indicated at the bottom of each panel. (B) Primer extension analysis of the transcription initiation site of CLN3. Arrows indicate the extended products and their position in the CLN3 sequence. (C) Schematic representation of the region upstream of the CLN3 coding sequence and the A-315T/CLN3 mutant. Relative positions of nucleotide sites including the TATAA box, the 5′ end of the mRNA and of the predicted upstream open reading frame (uORF), are indicated and numbered with respect to the initiation codon in CLN3 coding sequences. An ATG → TTG mutation in A-315/CLN3 cells eliminates the uORF.
Figure 2
Inactivation of the uORF in the CLN3 mRNA accelerates budding and DNA replication in a growth-rate dependent manner. (A) Percent difference of budded A-315T/CLN3 cells compared with CLN3 control cells during growth in rich media. Mutant and control cells were grown in YPD and budded cells were counted. The change in budded cells was calculated at four cell densities and the averages and standard deviations of three independent A-315T/CLN3 transformants from a representative experiment are shown. (B) Growth curves of CLN3 (solid line) and A-315T/CLN3 (dotted line) cells in YPD. Arrow indicates the point where accelerated completion of Start becomes evident in A-315T/CLN3 cells. (Below) Steady-state mRNA levels of ribosomal protein L16 (RPL16A) are shown on an RNA blot. Each lane was loaded with total RNA prepared from 3 × 10⁷ cells, growing in YPD at the indicated cell densities. (C) FACS analysis of cellular DNA content during growth in rich medium at the same cell densities as in A. (D) RNA blots showing the levels of CLN3, CLN2, and ACT1 mRNAs during growth in rich medium in the control (CLN3) and mutant (A-315T/CLN3) strain. Each lane was loaded with 10 μg of total RNA.
Figure 3
Inactivation of the uORF in the CLN3 mRNA accelerates budding and DNA replication, decreases cell size at Start, and increases resistance to α-factor in poor growth conditions. (A) Small G1 mutant and control cells were obtained by centrifugal elutriation from cultures growing in YPG to a cell density of 1 × 10⁶ cells/ml, and resuspended at the same cell density in the original clarified medium. At the indicated time points after resuspension, the percent of budded cells (%B) and cellular DNA content was determined. (B) The cellular DNA content of mutant and control cells was determined from cultures growing asynchronously in YPG to a density of 1 × 10⁶ cells/ml. (C) Cell size measurements of the whole cell populations grown in YPG to a density of 1 × 10⁶ cells/ml was determined by FACS. Cell numbers are plotted on the _y_-axis and the _x_-axis represents the forward angle scattering. Cell size measurements are relative and not absolute. (D) Sensitivity to α-factor of cells growing on YPG solid medium was tested at the indicated concentrations of α-factor. (E) RNA blots of CLN3, CLN2, and ACT1 mRNAs, as in Fig. 2D from cells grown in YPG to a density of 1 × 10⁶ cells/ml.
Figure 4
Polysomal profiles of wild-type (CLN3) and mutant (A-315T/CLN3) cells growing in rich (R) YPD medium, or minimal (MIN) SD medium. Polysomal extracts were fractionated as in Fig. 1, and RNA hybridization identified the distribution of ACT1 and CLN3 messages. The percentage of CLN3 message found in light and heavy polysomal fractions in MIN media, determined by densitometry, is indicated at the bottom of each panel.
Figure 5
(A) β-Galactosidase reporter assays in various growth conditions. The averages and standard deviations of β-galactosidase activity from multiple independent transformants of _CLN3_-lacZ (shaded bars) and A-315T/_CLN3_-lacZ (open bars) reporter plasmids, during growth at the indicated media are shown. (B) Translation of CLN3 is achieved by a leaky scanning mechanism. The averages and standard deviations of β-galactosidase activity from multiple independent transformants of each mutant plasmid are shown relative to that of the wild-type _CLN3_-lacZ plasmid, from cells growing in minimal (SD) medium. *In each case, the reported values were normalized for the steady-state levels of lacZ mRNA present in the cells (right). The lacZ mRNA levels for each construct were in turn normalized against actin mRNA levels (not shown).
Figure 6
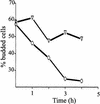
Eliminating the uORF in the CLN3 mRNA allows cells to complete Start in the presence of rapamycin. Rapamycin (0.2 μg/ml) was added to YPD cultures (cell density 1 × 10⁶ cells/ml) of control (CLN3) and mutant (A-315T/CLN3) strains, (○ and ▿, respectively). At the indicated time points, the percent of budded cells was counted.
Figure 7
Cln3p synthesis, and completion of Start, are particularly responsive to changes in the concentration of the translation initiation machinery. CLN3 expression is growth-rate dependent, because growth rate correlates with the cell’s ribosome content and, therefore, with the concentration of ribosomes competent to initiate translation. eIF3 (and possibly other initiation factors) influences translation of CLN3 because it is involved in all the steps along the formation of a preinitiation complex. Similarly, because the rapamycin-sensitive signal transduction pathway controls translation initiation (Barbet et al. 1996), it has a pronounced effect in Cln3p synthesis. Connections between these inputs are likely, because nutrients are known to affect the rapamycin-sensitive signaling pathway (Di Cono and Arndt 1996) and rapamycin also inhibits the function and synthesis of translation factors in mammalian cells (Terada et al. 1994; Beretta et al. 1996; Brown and Schreiber 1996; Brunn et al. 1997; Redpath et al. 1996).
References
- Baroni MD, Monti P, Alberghina L. Repression of growth-regulated G1 cyclin expression by cyclic AMP in budding yeast. Nature. 1994;371:339–342. - PubMed
Publication types
MeSH terms
Substances
LinkOut - more resources
Full Text Sources
Molecular Biology Databases
Research Materials


