Dynamic distribution of chemoattractant receptors in living cells during chemotaxis and persistent stimulation - PubMed (original) (raw)
Dynamic distribution of chemoattractant receptors in living cells during chemotaxis and persistent stimulation
Z Xiao et al. J Cell Biol. 1997.
Abstract
While the localization of chemoattractant receptors on randomly oriented cells has been previously studied by immunohistochemistry, the instantaneous distribution of receptors on living cells undergoing directed migration has not been determined. To do this, we replaced cAR1, the primary cAMP receptor of Dictyostelium, with a cAR1-green fluorescence protein fusion construct. We found that this chimeric protein is functionally indistinguishable from wild-type cAR1. By time-lapse imaging of single cells, we observed that the receptors remained evenly distributed on the cell surface and all of its projections during chemotaxis involving turns and reversals of polarity directed by repositioning of a chemoattractant-filled micropipet. Thus, cell polarization cannot result from a gradient-induced asymmetric distribution of chemoattractant receptors. Some newly extended pseudopods at migration fronts showed a transient drop in fluorescence signals, suggesting that the flow of receptors into these zones may slightly lag behind the protrusion process. Challenge with a uniform increase in chemoattractant, sufficient to cause a dramatic decrease in the affinity of surface binding sites and cell desensitization, also did not significantly alter the distribution profile. Hence, the induced reduction in binding activity and cellular sensitivity cannot be due to receptor relocalization. The chimeric receptors were able to "cap" rapidly during treatment with Con A, suggesting that they are mobile in the plane of the cell membrane. This capping was not influenced by pretreatment with chemoattractant.
Figures
Figure 1
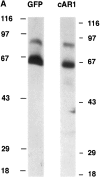
cAR1-GFP is functionally indistinguishable from wild-type cAR1. (A) cAR1-GFP fusion protein as detected by immunoblotting with GFP and cAR1 antisera. Proteins were solubilized in SDS-sample buffer, resolved on 10% SDS-PAGE, and transferred onto PVDF membranes. Duplicate samples were loaded and analyzed in parallel. In the left lane, the fusion protein was detected with affinity-purified anti-GFP antibodies. In the right lane, it was detected with anti-cAR1 antiserum. (B) Both the major and minor forms of cAR1-GFP are localized to a detergent-resistant plasma membrane subdomain. Whole cells (lane 1) were extracted with 1.5% CHAPS at 4°C and lysate separated into soluble (lane 2) and detergent-resistant membrane (lane 3) fractions by centrifugation, as described in Materials and Methods. Protein samples were resolved by SDS-PAGE, transferred to membranes, and fusion protein detected by anti-cAR1 antibody. (C) Agonist-induced phosphorylation of cAR1-GFP and gel mobility shift assay. cAR1-GFP cells were treated with increasing doses of cAMP for 15 min to induce the phosphorylation of the COOH terminus of cAR1. cAMP doses: 1, 0 nM; 2, 5 nM; 3, 20 nM; 4, 50 nM; 5, 100 nM; 6, 200 nM; 7, 500 nM; 8, 1 μM; and 9, 5 μM. The unmodified or phosphorylated forms of the fusion receptor were detected with cAR1 antiserum. (D) cAR1-GFP cells express the same total surface cAMP-binding sites as wild-type cAR1 cells. cAR1-GFP and cAR1 expressing cells were washed in PB and resuspended to 1 × 10⁸ cells/ml density in ice-cold PB. 60 μl cells were used in the ammonium sulfate-binding assay (Materials and Methods). The specific binding for both cell lines in cpm were compared and later translated into the number of binding sites per cell (see text).
Figure 2
cAR1-GFP rescues the developmental defect of cAR1-null cells. The cAR1 null cell line was transformed with 1, cAR1-GFP construct; 2, wild-type cAR1; and 3, empty vector. Transformed cells were washed with DB and developed on a 35-mm agar plate (1 × 10⁷ cells/plate). After 36 h, pictures were taken of each plate for the formation of fruiting bodies.
Figure 3
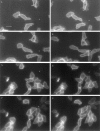
Distribution of cAR1-GFP during chemotaxis. All figures shown were fluorescence images captured in a 50–100-millisecond exposure; phase contrast images were unnecessary since cell shapes were obvious from the peripheral fluorescence of cAR1-GFP. There was a 10-15 second interval between consecutive frames. Frames 1–4 show the complete sequence of one chemotaxis event, frames 5–8 showed another. Positions of the micropipette were indicated by “*”. Arrowheads indicate pseudopods. Bar, 5 μm.
Figure 4
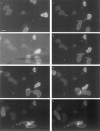
Distribution of cAR1-GFP during cell turning after chemoattractant source movement. Sequence shows cells turning in response to cAMP source movement. Frame 3 is a phase-contrast image to highlight the micropipette position shift. In frames 1 and 2, asterisks indicate the original cAMP source; in all other frames, the asterisk denotes the new position. Pseudopod positions were indicated with arrowheads. Time interval is 15 s. Bar, 5 μm.
Figure 5
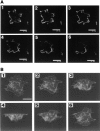
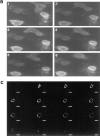
(A) Z-axis two-dimensional confocal fluorescence image scanning analysis of cAR1-GFP cells. Cells adhering to a glass coverslip were fixed in 4% paraformaldehyde/0.1% Triton X-100 and subjected to confocal analysis. Section thickness: 0.5 μm; frame interval: 1.0 μm. (B) Three-dimensional reconstruction image of cAR1-GFP cell fluorescence. All three-dimensional images were created from a Z-axis scanning series with the Intervision 1.6 software program. The reconstructed image was rotated around the X-axis for 150° starting from the bottom to top image (top of cell projecting into paper plane). Images were captured every 30°. Final image shows top to bottom view. Bars, 10 μm.
Figure 6
(A) Cells expressing cAR1-GFP receptors display normal desensitization properties. Wild-type cAR1 cells and cAR1-GFP cells were washed in PB and treated with either buffer (control) or 10−5 M cAMP in the presence of 10 mM DTT for 15 min to induce LLB. After extensive washing, the cells were assayed for their cAMP binding (16 nM [3H]cAMP) in PB (Materials and Methods). The binding was expressed as a percentage of the binding obtained from buffer-treated control cells. (B) Distribution of desensitized cAR1-GFP analyzed through time-lapse fluorescence imaging. All frames are fluorescence images. Frame 1 showed the cell in random movement. cAMP was applied 5 s before frame 2 was taken. Time interval is 1 min between 2 and 4; 90 s between 4 and 6. (C) Z-axis confocal analysis of receptor distribution on desensitized cells. Cells were pretreated with excess cAMP for 5 to 10 min to induce desensitization and then quickly fixed with 4% paraformaldehyde/0.08% Triton X-100. Z-axis sections were taken from the bottom of the cell (substrate adhesion side) to the top surface. Section thickness: 0.5 μm; frame distance: 1.0 μm. Bars, 10 μm.
Figure 7
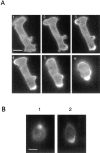
(A) Con A treatment of cAR1-GFP cells to induce receptor capping. All images are fluorescence ones. Frame 1: cell before treatment. Frames 2–6: after application of 50 μg/ml Con A. Con A was applied 15 s before frame 2 was taken. Time interval is 45 s. In frames 2 and 3, arrowheads indicate patching and capping of signals. In frames 5 and 6, they show the regions devoid of signals. (B) Desensitized cells can still carry out efficient Con A-induced receptor capping. Cells were either pretreated with buffer (1) or 10−5 M cAMP (2) for 10 min to induce desensitization. Con A was then added to induce receptor capping. Images were taken after 5 min of Con A addition.
Similar articles
- Dynamics of a chemoattractant receptor in living neutrophils during chemotaxis.
Servant G, Weiner OD, Neptune ER, Sedat JW, Bourne HR. Servant G, et al. Mol Biol Cell. 1999 Apr;10(4):1163-78. doi: 10.1091/mbc.10.4.1163. Mol Biol Cell. 1999. PMID: 10198064 Free PMC article. - The cell density factor CMF regulates the chemoattractant receptor cAR1 in Dictyostelium.
Van Haastert PJ, Bishop JD, Gomer RH. Van Haastert PJ, et al. J Cell Biol. 1996 Sep;134(6):1543-9. doi: 10.1083/jcb.134.6.1543. J Cell Biol. 1996. PMID: 8830781 Free PMC article. - G protein linked signal transduction pathways in development: dictyostelium as an experimental system.
Firtel RA, van Haastert PJ, Kimmel AR, Devreotes PN. Firtel RA, et al. Cell. 1989 Jul 28;58(2):235-9. doi: 10.1016/0092-8674(89)90837-4. Cell. 1989. PMID: 2546676 Review. No abstract available. - Chemotactic receptors of Dictyostelium discoideum.
Frazier WA, Nandini-Kishore SG, Meyers BL. Frazier WA, et al. J Cell Biochem. 1982;18(2):181-96. doi: 10.1002/jcb.1982.240180206. J Cell Biochem. 1982. PMID: 6279688 Review. No abstract available.
Cited by
- Asymmetrical macromolecular complex formation of lysophosphatidic acid receptor 2 (LPA2) mediates gradient sensing in fibroblasts.
Ren A, Moon C, Zhang W, Sinha C, Yarlagadda S, Arora K, Wang X, Yue J, Parthasarathi K, Heil-Chapdelaine R, Tigyi G, Naren AP. Ren A, et al. J Biol Chem. 2014 Dec 26;289(52):35757-69. doi: 10.1074/jbc.M114.595512. Epub 2014 Nov 5. J Biol Chem. 2014. PMID: 25542932 Free PMC article. - The principles of directed cell migration.
SenGupta S, Parent CA, Bear JE. SenGupta S, et al. Nat Rev Mol Cell Biol. 2021 Aug;22(8):529-547. doi: 10.1038/s41580-021-00366-6. Epub 2021 May 14. Nat Rev Mol Cell Biol. 2021. PMID: 33990789 Free PMC article. Review. - Epidermal growth factor receptor distribution during chemotactic responses.
Bailly M, Wyckoff J, Bouzahzah B, Hammerman R, Sylvestre V, Cammer M, Pestell R, Segall JE. Bailly M, et al. Mol Biol Cell. 2000 Nov;11(11):3873-83. doi: 10.1091/mbc.11.11.3873. Mol Biol Cell. 2000. PMID: 11071913 Free PMC article. - Polarization of chemoattractant receptor signaling during neutrophil chemotaxis.
Servant G, Weiner OD, Herzmark P, Balla T, Sedat JW, Bourne HR. Servant G, et al. Science. 2000 Feb 11;287(5455):1037-40. doi: 10.1126/science.287.5455.1037. Science. 2000. PMID: 10669415 Free PMC article. - Polarization of the yeast pheromone receptor requires its internalization but not actin-dependent secretion.
Suchkov DV, DeFlorio R, Draper E, Ismael A, Sukumar M, Arkowitz R, Stone DE. Suchkov DV, et al. Mol Biol Cell. 2010 May 15;21(10):1737-52. doi: 10.1091/mbc.e09-08-0706. Epub 2010 Mar 24. Mol Biol Cell. 2010. PMID: 20335504 Free PMC article.
References
- Baiocchi M, Olivetta E, Chelucci C, Santarcangelo AC, Bona R, d'Aloja P, Testa U, Komatsu N, Verani P, Federico M. Human immunodeficiency virus (HIV)-resistant CD4+ UT-7 megakaryocytic human cell line becomes highly HIV-1 and HIV-2 susceptible upon CXCR4 transfection: induction of cell differentiation by HIV-1 infection. Blood. 1997;89:2670–2678. - PubMed
- Barak LS, Tiberi M, Freedman NJ, Kwatra MM, Lefkowitz RJ, Caron MG. A highly conserved tyrosine residue in G protein-coupled receptors is required for agonist-mediated β 2-adrenergic receptor sequestration. J Biol Chem. 1994;269:2790–2795. - PubMed
- Behar TN, Schaffner AE, Tran HT, Barker JL. Correlation of gp140trk expression and NGF-induced neuroblast chemotaxis in the embryonic rat spinal cord. Brain Res. 1994;664:155–166. - PubMed
- Caterina MJ, Devreotes PN, Borleis J, Hereld D. Agonist- induced loss of ligand binding is correlated with phosphorylation of cAR1, a G protein-coupled chemoattractant receptor from Dictyostelium. . J Biol Chem. 1995;270:8667–8672. - PubMed
- Chen X, Berrou J, Nguyen G, Sraer JD, Rondeau E. Endothelin-1 induces rapid and long lasting internalization of the thrombin receptor in human glomerular epithelial cells. Biochem Biophys Res Commun. 1995;217:445–451. - PubMed
Publication types
MeSH terms
Substances
LinkOut - more resources
Full Text Sources
Miscellaneous
