Activity-dependent regulation of NMDAR1 immunoreactivity in the developing visual cortex - PubMed (original) (raw)
Activity-dependent regulation of NMDAR1 immunoreactivity in the developing visual cortex
S M Catalano et al. J Neurosci. 1997.
Abstract
NMDA receptors have been implicated in activity-dependent synaptic plasticity in the developing visual cortex. We examined the distribution of immunocytochemically detectable NMDAR1 in visual cortex of cats and ferrets from late embryonic ages to adulthood. Cortical neurons are initially highly immunostained. This level declines gradually over development, with the notable exception of cortical layers 2/3, where levels of NMDAR1 immunostaining remain high into adulthood. Within layer 4, the decline in NMDAR1 immunostaining to adult levels coincides with the completion of ocular dominance column formation and the end of the critical period for layer 4. To determine whether NMDAR1 immunoreactivity is regulated by retinal activity, animals were dark-reared or retinal activity was completely blocked in one eye with tetrodotoxin (TTX). Dark-rearing does not cause detectable changes in NMDAR1 immunoreactivity. However, 2 weeks of monocular TTX administration decreases NMDAR1 immunoreactivity in layer 4 of the columns of the blocked eye. Thus, high levels of NMDAR1 immunostaining within the visual cortex are temporally correlated with ocular dominance column formation and developmental plasticity; the persistence of staining in layers 2/3 also correlates with the physiological plasticity present in these layers in the adult. In addition, visual experience is not required for the developmental changes in the laminar pattern of NMDAR1 levels, but the presence of high levels of NMDAR1 in layer 4 during the critical period does require retinal activity. These observations are consistent with a central role for NMDA receptors in promoting and ultimately limiting synaptic rearrangements in the developing neocortex.
Figures
Fig. 9.
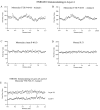
Periodic fluctuations in NMDAR1 immunostaining intensity occur within layer 4 of two animals monocularly injected with TTX from P40–53 (A, B). No such fluctuations are present within layer 4 of control citrate buffer-injected (C) or normal (D) age-matched animals, or within layers 2/3 and 6 of the TTX-injected animal shown in A(E) (see Materials and Methods for details).
Fig. 10.
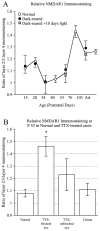
Ratio of layers 2/3/layer 4 NMDAR1 immunostaining intensity compared across ages and experimental conditions in cats (±SD). Average immunostaining levels were calculated for each layer from digitized images, and ratios were determined. A, Comparison of developmental changes in the ratios for normally reared or dark-reared animals. Layers 2/3 are consistently darker than layer 4 at most ages except between P34 and 53, when the two layers are equivalent in intensity (A). There is no significant difference in immunostaining ratios between normal animals and age-matched dark-reared animals or dark-reared animals exposed to light.B, Ratios for normally reared and monocularly TTX-treated cases shown in histogram form. Immunostaining intensity ratios do not vary significantly between normal P53 animals and control animals receiving monocular injections of citrate between P40 and P53 (p < 0.15) (B) or from the columns pertaining to the unblocked eye (p< 0.005). However, note that immunostaining ratios obtained from the columns of the TTX-injected eye are significantly greater than those from normal animals (p < 0.00005; two-tailed t test).
Fig. 1.
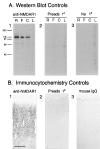
A, Western blots show that the monoclonal antibody recognizes a band of the same molecular weight as NMDAR1. A1, Staining of rat (R), ferret (F), and cat (C) synaptic plasma membranes and ferret liver membranes (L) with the primary anti-NMDAR1 antibody yields a prominent band at _M_r ∼117 kDa. This band is no longer stained when the primary antibody is preadsorbed to its fusion protein immunogen (A2), or omitted (A3). B, Controls for the specificity of NMDAR1 antibody immunostaining on tissue sections. Cellular staining is intense in sections that have been incubated in primary antibody (B1); however, preadsorbtion of the primary antibody with the fusion protein that it was raised against (B2) or substitution of the primary antibody with generic IgG protein from the same species as the primary (mouse IgG) (B3) protein results in the near-absence of cellular staining. Scale bar (B1–3): 300 μm.
Fig. 2.
The pattern of NMDAR1 immunoreactivity during the development of the ferret visual cortex at E35(A, B), P3 (C),P20 (D), P49(E), P84(F), and Adult(G). Laminar boundaries are indicated by_horizontal bars_. CP, Cortical plate;SP, subplate; IZ, intermediate zone;VZ, ventricular zone; 1–6, cortical layers 1–6. Scale bar (bottom left in_E_): A, C, D, 110 μm; B, 55 μm; E–G, 200 μm.
Fig. 3.
NMDAR1 immunoreactivity in the developing cat visual cortex at E42 (A),P0 (B), P28(C), P40(D), P108(E), and Adult(F). Note the progressive loss of staining from the deeper cortical layers at older ages. See Figure 2 for abbreviations. Scale bar (bottom left in_D_): A, C, 120 μm; B, 230 μm; D, E, F, 300 μm.
Fig. 4.
Photomicrograph at higher magnification showing NMDAR1 immunostained cells at the border between layers 4 and 5 (A) and layers 2/3 and 1 (B) in a P40 cat. A, Many cells in layers 4 and 5 are immunoreactive, but the cells in layer 5 are far less intensely stained than those in layer 4. Both pyramidal and stellate cells are immunoreactive. B, The neuropil within layers 2/3 is more intensely stained than that of layer 1. Apical dendrites (arrow) appear to be as intensely immunoreactive as their parent cell soma. Scale bar (bottom left in A): 50 μm.
Fig. 5.
Decline in immunostaining for NMDAR1 in layer 4 with progressive development compared in cat (top) and ferret (bottom) visual cortex. Intensely immunoreactive cells are visible both in layers 4 and 2/3 in P52 cat (A) and in P49 ferret (C). At these ages, cells in layers 5 and 6 are much less intensely immunoreactive than cells in layers 2/3. By the end of the cat critical period (B) (P76) and in adult ferrets (D), this intense immunoreactivity persists in layers 2/3 but is gone from layer 4; cells in layer 4 exhibit staining similar to that found in the lower layers. Scale bar, 300 μm.
Fig. 6.
Dark-rearing does not alter the laminar pattern of immunostaining in primary visual cortex. At P15 in both normal cats (A) and after 2 weeks of dark-rearing beginning at P1 (B), layers 2/3 and 5 are stained most intensely. At P53, layer 4 is equally as intensely stained as layers 2/3 in both normal (C) and dark-reared (D) animals. At P104, the visual cortex of normal animals (E) and animals dark-reared from shortly after birth (F) exhibit high levels of immunostaining in layers 2/3, whereas layers 4–6 are stained less intensely. Scale bar, 300 μm.
Fig. 7.
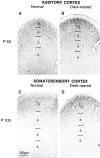
Developmental changes in laminar patterns of NMDAR1 immunostaining occur over the same time period throughout cat neocortex. A, Primary auditory cortex at P53.B, Primary auditory cortex at P53 in an animal dark-reared from shortly after birth to P53. Layers 4 and 2/3 are more intensely immunoreactive than the lower layers, and dark-rearing does not affect this pattern of staining. C, Primary somatosensory cortex of normal animal aged P104. D, Primary somatosensory cortex in an animal dark-reared to P104. At this age, somatosensory cortex exhibits relatively intense staining for NMDAR1 in layers 2/3 but not in the other layers. These same laminar-specific patterns of immunostaining are seen in visual cortex at the same ages (compare with Figs. 5_A_, 6_E_). Scale bar, 300 μm.
Fig. 8.
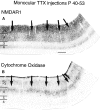
Monocular TTX injection from P40 to P53 decreases NMDAR1 immunostaining in injected eye columns of layer 4 in cat visual cortex. Adjacent sections stained for NMDAR1 immunocytochemistry (A) or for CO histochemistry (B). Note higher levels of NMDAR1 immunostaining (A) and CO activity (B) in patches (arrows) in layer 4 corresponding to the uninjected eye. Scale bar (shown in A): 500 μm.
Fig. 11.
Summary of developmental changes in the laminar pattern of NMDAR1 immunoreactivity in cat neocortex. Ages at the top correspond to those examined in this study. Each cortical layer is represented by its most prominent cell type (large or small pyramidal or stellate cells). Black cells indicate high levels of NMDAR1 immunostaining; gray cells are stained less intensely. The bar at the bottom of figure is a timeline of the major anatomical events in cat visual cortex development. Note gradual decline in immunostaining of deep cortical layers (5 and 6) with age, transient elevation of staining in layer 4 between P34 and P53, and maintenance of high levels of immunostaining in layers 2/3 into adulthood.
Similar articles
- Patchy distribution of NMDAR1 subunit immunoreactivity in developing visual cortex.
Trepel C, Duffy KR, Pegado VD, Murphy KM. Trepel C, et al. J Neurosci. 1998 May 1;18(9):3404-15. doi: 10.1523/JNEUROSCI.18-09-03404.1998. J Neurosci. 1998. PMID: 9547247 Free PMC article. - Rapid regulation of brain-derived neurotrophic factor mRNA within eye-specific circuits during ocular dominance column formation.
Lein ES, Shatz CJ. Lein ES, et al. J Neurosci. 2000 Feb 15;20(4):1470-83. doi: 10.1523/JNEUROSCI.20-04-01470.2000. J Neurosci. 2000. PMID: 10662837 Free PMC article. - Effect of monocular deprivation on NMDAR1 immunostaining in ocular dominance columns of the marmoset Callithrix jacchus.
Fonta C, Chappert C, Imbert M. Fonta C, et al. Vis Neurosci. 2000 May-Jun;17(3):345-52. doi: 10.1017/s0952523800173031. Vis Neurosci. 2000. PMID: 10910103 - Distribution and synaptic localization of immunocytochemically identified NMDA receptor subunit proteins in sensory-motor and visual cortices of monkey and human.
Huntley GW, Vickers JC, Janssen W, Brose N, Heinemann SF, Morrison JH. Huntley GW, et al. J Neurosci. 1994 Jun;14(6):3603-19. doi: 10.1523/JNEUROSCI.14-06-03603.1994. J Neurosci. 1994. PMID: 8207475 Free PMC article.
Cited by
- Rapid, experience-dependent changes in levels of synaptic zinc in primary somatosensory cortex of the adult mouse.
Brown CE, Dyck RH. Brown CE, et al. J Neurosci. 2002 Apr 1;22(7):2617-25. doi: 10.1523/JNEUROSCI.22-07-02617.2002. J Neurosci. 2002. PMID: 11923427 Free PMC article. - Molecular analysis of developmental plasticity in neocortex.
Nedivi E. Nedivi E. J Neurobiol. 1999 Oct;41(1):135-47. J Neurobiol. 1999. PMID: 10504201 Free PMC article. Review. - Functional connectivity between the superficial and deeper layers of the superior colliculus: an anatomical substrate for sensorimotor integration.
Doubell TP, Skaliora I, Baron J, King AJ. Doubell TP, et al. J Neurosci. 2003 Jul 23;23(16):6596-607. doi: 10.1523/JNEUROSCI.23-16-06596.2003. J Neurosci. 2003. PMID: 12878701 Free PMC article. - Thalamic activity that drives visual cortical plasticity.
Linden ML, Heynen AJ, Haslinger RH, Bear MF. Linden ML, et al. Nat Neurosci. 2009 Apr;12(4):390-2. doi: 10.1038/nn.2284. Epub 2009 Mar 1. Nat Neurosci. 2009. PMID: 19252494 Free PMC article. - Developmental profile of tissue plasminogen activator in postnatal Long Evans rat visual cortex.
Zheng S, Yin ZQ, Zeng YX. Zheng S, et al. Mol Vis. 2008 May 28;14:975-82. Mol Vis. 2008. PMID: 18523654 Free PMC article.
References
- Antonini A, Stryker MP. Rapid remodeling of axonal arbors in the visual cortex. Science. 1993a;260:1819–1821. - PubMed
- Bear MF. NMDA-receptor-dependent synaptic plasticity in the visual cortex. Prog Brain Res. 1996;108:205–218. - PubMed
- Bear MF, Malenka RC. Synaptic plasticity: LTP and LTD. Curr Opin Neurobiol. 1994;4:389–399. - PubMed
Publication types
MeSH terms
Substances
Grants and funding
- R37 EY002858/EY/NEI NIH HHS/United States
- R01 EY002858/EY/NEI NIH HHS/United States
- R32 EY02858/EY/NEI NIH HHS/United States
- EY06491/EY/NEI NIH HHS/United States
- F32 EY006491/EY/NEI NIH HHS/United States
LinkOut - more resources
Full Text Sources
Miscellaneous
