Determining divergence times with a protein clock: update and reevaluation - PubMed (original) (raw)
Determining divergence times with a protein clock: update and reevaluation
D F Feng et al. Proc Natl Acad Sci U S A. 1997.
Abstract
A recent study of the divergence times of the major groups of organisms as gauged by amino acid sequence comparison has been expanded and the data have been reanalyzed with a distance measure that corrects for both constraints on amino acid interchange and variation in substitution rate at different sites. Beyond that, the availability of complete genome sequences for several eubacteria and an archaebacterium has had a great impact on the interpretation of certain aspects of the data. Thus, the majority of the archaebacterial sequences are not consistent with currently accepted views of the Tree of Life which cluster the archaebacteria with eukaryotes. Instead, they are either outliers or mixed in with eubacterial orthologs. The simplest resolution of the problem is to postulate that many of these sequences were carried into eukaryotes by early eubacterial endosymbionts about 2 billion years ago, only very shortly after or even coincident with the divergence of eukaryotes and archaebacteria. The strong resemblances of these same enzymes among the major eubacterial groups suggest that the cyanobacteria and Gram-positive and Gram-negative eubacteria also diverged at about this same time, whereas the much greater differences between archaebacterial and eubacterial sequences indicate these two groups may have diverged between 3 and 4 billion years ago.
Figures
Figure 1
Evolutionary distances calculated according to Grishin (9) plotted against divergence times from the vertebrate fossil record. Error bars are standard deviations.
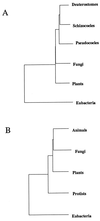
Figure 2
Phylogenetic trees of major groups of eukaryotes based on mean intergroup distances; the eubacteria were used as outlier for obtaining the topology of other groups. (A) Based on 11 fully represented enzyme sets. (B) Based on average intergroup distances for all enzyme sets. In both cases the plant divergence was taken to be 1200 Mya.
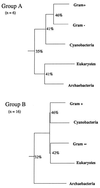
Figure 3
(A) Phylogeny of eukaryotes, archaebacteria, and principal eubacterial groups as determined with six of the eight enzyme sets in which the archaebacteria are nearest neighbors with eukaryotes (group A in Table 1; two of the enzyme sets were not included because sequences were not available for all bacterial groups). (B) Phylogeny of the same groups determined with 16 of the 17 enzymes sets in which the archaebacteria are outliers (group B in Table 1; in the case of lactate dehydrogenase, sequences were not available for all bacterial groups). Average sequence resemblances (% identical) are shown at key divergence points.
Comment in
- Fun with genealogy.
Doolittle WF. Doolittle WF. Proc Natl Acad Sci U S A. 1997 Nov 25;94(24):12751-3. doi: 10.1073/pnas.94.24.12751. Proc Natl Acad Sci U S A. 1997. PMID: 9398070 Free PMC article. No abstract available.
Similar articles
- The neomuran origin of archaebacteria, the negibacterial root of the universal tree and bacterial megaclassification.
Cavalier-Smith T. Cavalier-Smith T. Int J Syst Evol Microbiol. 2002 Jan;52(Pt 1):7-76. doi: 10.1099/00207713-52-1-7. Int J Syst Evol Microbiol. 2002. PMID: 11837318 Review. - Evolution of HSP70 gene and its implications regarding relationships between archaebacteria, eubacteria, and eukaryotes.
Gupta RS, Golding GB. Gupta RS, et al. J Mol Evol. 1993 Dec;37(6):573-82. doi: 10.1007/BF00182743. J Mol Evol. 1993. PMID: 8114110 - Rooting the archaebacterial tree: the pivotal role of Thermococcus celer in archaebacterial evolution.
Achenbach-Richter L, Gupta R, Zillig W, Woese CR. Achenbach-Richter L, et al. Syst Appl Microbiol. 1988;10:231-40. doi: 10.1016/s0723-2020(88)80007-9. Syst Appl Microbiol. 1988. PMID: 11542150 - Protein phylogenies and signature sequences: A reappraisal of evolutionary relationships among archaebacteria, eubacteria, and eukaryotes.
Gupta RS. Gupta RS. Microbiol Mol Biol Rev. 1998 Dec;62(4):1435-91. doi: 10.1128/MMBR.62.4.1435-1491.1998. Microbiol Mol Biol Rev. 1998. PMID: 9841678 Free PMC article. Review.
Cited by
- Persistence and plasticity in bacterial gene regulation.
Baumgart LA, Lee JE, Salamov A, Dilworth DJ, Na H, Mingay M, Blow MJ, Zhang Y, Yoshinaga Y, Daum CG, O'Malley RC. Baumgart LA, et al. Nat Methods. 2021 Dec;18(12):1499-1505. doi: 10.1038/s41592-021-01312-2. Epub 2021 Nov 25. Nat Methods. 2021. PMID: 34824476 - Ancient Antibiotics, Ancient Resistance.
Waglechner N, Culp EJ, Wright GD. Waglechner N, et al. EcoSal Plus. 2021 Mar;9(2):eESP-0027-2020. doi: 10.1128/ecosalplus.ESP-0027-2020. EcoSal Plus. 2021. PMID: 33734062 Free PMC article. Review. - Eco-evolutionary feedbacks mediated by bacterial membrane vesicles.
Zlatkov N, Nadeem A, Uhlin BE, Wai SN. Zlatkov N, et al. FEMS Microbiol Rev. 2021 Mar 16;45(2):fuaa047. doi: 10.1093/femsre/fuaa047. FEMS Microbiol Rev. 2021. PMID: 32926132 Free PMC article. Review. - The evolution of MarR family transcription factors as counter-silencers in regulatory networks.
Will WR, Fang FC. Will WR, et al. Curr Opin Microbiol. 2020 Jun;55:1-8. doi: 10.1016/j.mib.2020.01.002. Epub 2020 Feb 7. Curr Opin Microbiol. 2020. PMID: 32044654 Free PMC article. Review. - Multidomain ribosomal protein trees and the planctobacterial origin of neomura (eukaryotes, archaebacteria).
Cavalier-Smith T, Chao EE. Cavalier-Smith T, et al. Protoplasma. 2020 May;257(3):621-753. doi: 10.1007/s00709-019-01442-7. Epub 2020 Jan 3. Protoplasma. 2020. PMID: 31900730 Free PMC article. Review.
References
- Doolittle R F, Feng D-F, Tsang S, Cho G, Little E. Science. 1996;271:470–477. - PubMed
- Morrell V. Science. 1996;271:448. - PubMed
- Hasegawa M, Fitch W M. Science. 1996;274:1750. - PubMed
- Gogarten J P, Olendzenski L, Hilario E, Simon C, Holsinger K E. Science. 1996;274:1750–1751. - PubMed
- Miyamoto M, Fitch W M. Syst Biol. 1996;45:566–573. - PubMed
Publication types
MeSH terms
Substances
LinkOut - more resources
Full Text Sources


