Compartmentalized IgE receptor-mediated signal transduction in living cells - PubMed (original) (raw)
Compartmentalized IgE receptor-mediated signal transduction in living cells
T P Stauffer et al. J Cell Biol. 1997.
Abstract
Several receptor-mediated signal transduction pathways, including EGF and IgE receptor pathways, have been proposed to be spatially restricted to plasma membrane microdomains. However, the experimental evidence for signaling events in these microdomains is largely based on biochemical fractionation and immunocytochemical studies and only little is known about their spatial dynamics in living cells. Here we constructed green fluorescent protein-tagged SH2 domains to investigate where and when IgE receptor (FcepsilonRI)-mediated tyrosine phosphorylation occurs in living tumor mast cells. Strikingly, within minutes after antigen addition, tandem SH2 domains from Syk or PLC-gamma1 translocated from a uniform cytosolic distribution to punctuate plasma membrane microdomains. Colocalization experiments showed that the microdomains where tyrosine phosphorylation occurred were indistinguishable from those stained by cholera toxin B, a marker for glycosphingolipids. Competitive binding studies with coelectroporated unlabeled Syk, PLC-gamma1, and other SH2 domains selectively suppressed the induction of IgE receptor-mediated calcium signals as well as the binding of the fluorescent SH2 domains. This supports the hypothesis that PLC-gamma1 and Syk SH2 domains selectively bind to Syk and IgE receptors, respectively. Unlike the predicted prelocalization of EGF receptors to caveolae microdomains, fluorescently labeled IgE receptors were found to be uniformly distributed in the plasma membrane of unstimulated cells and only transiently translocated to glycosphingolipid rich microdomains after antigen addition. Thus, these in vivo studies support a plasma membrane signaling mechanism by which IgE receptors transiently associate with microdomains and induce the spatially restricted activation of Syk and PLC-gamma1.
Figures
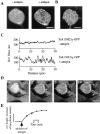
Figure 1
Cross-linking of IgE receptor leads to the translocation of GFP-tagged Syk tandem SH2 domains from the cytosol to distinct plasma membrane microdomains. (A) GFP-Syk SH2 domains were expressed in RBL cells by RNA transfection to monitor the translocation of Syk SH2 domains in vivo. A midsection of the same cell is shown before and 3 min after the addition of antigen (500 ng/ml DNP-BSA). (B) Confocal section of the cell surface 3 min after antigen addition. The same experimental conditions as in A were used. (C) One-dimensional plasma membrane fluorescence intensity profiles for a midsection segment before and after activation with antigen. (D) The time course of the plasma membrane translocation of the Syk SH2 domains GFP probe is shown in a confocal midsection of the same cell. The arrow points to one of the sites where a strong punctate membrane staining appears. (E) Plot of the increase of the total plasma membrane fluorescence intensity at different time points after activation of the cells with antigen (average of four cells). Bar, 10 μm.
Figure 2
Control measurements, showing that punctate plasma membrane staining can also be seen after antigen addition with fluorescently labeled recombinant Syk SH2 domains but not with the GFP-tagged phospholipid binding pleckstrin-PH domain. (A) The translocation of Syk SH2 domains was also observed when recombinant Syk SH2 domains were labeled with Cy2 and introduced into RBL cells by microporation. The images show cells that were fixed 3 min after antigen addition (to minimize the cytosolic background staining). The stimulation conditions were the same as in Fig. 1_A._ (B) Plasma membrane localization of GFP-pleckstrin PH domain in living cells 3 min after stimulation. Antigen activation had no significant effect on the distribution of PH domains. (C) One-dimensional plasma membrane fluorescence intensity profiles for a membrane segment of cells that expressed GFP-tagged pleckstrin PH domain. Bar, 10 μm.
Figure 3
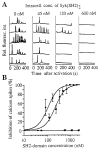
Importance of Syk and PLC-γ1 SH2 domains for antigen-mediated calcium signaling. (A) IgE receptor– mediated calcium spiking is progressively inhibited at increasing concentrations of recombinant Syk SH2 domains. RBL cells were coelectroporated with fluo-3 and SH2 domains, and intracellular concentrations of SH2 domains were estimated by the relative fluorescence intensity of coelectroporated fluo3 fluorescence (see reference for calibration). Calcium spikes were recorded as a function of time after crosslinking of IgE receptor with DNP-BSA (50 ng/ml). The shown fluorescence intensity traces reflect calcium responses after IgE receptor activation in the presence of different concentrations of Syk SH2 domains. (B) Concentration-dependent inhibition of calcium spiking by Syk (squares) and PLC-γ1 SH2 domains (circles). SH2 domains from Abl (triangle) and PI3 kinase (cross) did not affect IgE receptor–mediated calcium signaling even at maximal concentrations. (C) The triggering of G protein–coupled calcium signals is not affected by recombinant Syk or PLC-γ1 SH2 domains. RBL cells with stably transfected FMLP receptors were activated with FMLP (10 μM) or with antigen (50 ng/ml) at different time points. Different protocols are shown with either antigen added alone, FMLP added alone, or both added sequentially (with the FMLP addition 4 min after the antigen addition).
Figure 4
Syk and PLC-γ1 SH2 domains bind to different binding partners. (A) The translocation of fluorescently labeled Syk SH2 domain to the plasma membrane (left) is suppressed in the presence of high concentrations of unlabeled Syk SH2 domains (middle) but not suppressed in the presence of high concentrations of unlabeled PLC-γ1 SH2 domains (right). (B) Fluorescently labeled PLC-γ1 SH2 domains translocate to the plasma membrane (left) upon stimulation with antigen. The translocation is suppressed in the presence of high concentrations of unlabeled Syk (middle) or PLC-γ1 SH2 domains (right). Bar, 10 μm.
Figure 5
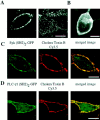
Colocalization of GFP-tagged Syk and PLC-γ1 SH2 domains with the glycosphingolipid marker cholera toxin B in antigen stimulated RBL cells. (A) Cholera toxin B staining in a midsection (left) and surface section (right) of unstimulated RBL cells. (B) Plasma membrane staining of unstimulated RBL cells with FM 1-43. (C) Colocalization of GFP-Syk SH2 domain (green) and cholera toxin B Cy3.5 (red) in RBL cells 3 min after cross-linking of IgE receptors with 500 ng/ml DNP-BSA. The color yellow in the overlay image on the right indicates a colocalization of SH2 domains and cholera toxin B. (D) Same as in C but with GFP-PLC-γ1 SH2 domain instead of Syk SH2 domains. (E) One-dimensional plasma membrane fluorescence intensity profiles of the GFP-Syk SH2 domains and cholera toxin B-Cy3.5 of the cell shown in C. (F) Correlation analysis of cells costained with the Syk-SH2 and cholera toxin B probes 3 min after antigen activation (average of five cells). (G) Correlation analysis of cells costained with the PLC-γ1 SH2 domain and cholera toxin B probes 3 min after antigen activation (average of six cells). The relatively high correlation peak in the traces in E and F indicates a high degree of colocalization in the two images. (F and G) As a control, a comparison of the colocalization of cholera toxin B with GFP-tagged PH domains and FM 1-43 was included in F and G, respectively. Bars, 10 μm.
Figure 6
IgE receptors (FcεRI) redistribute from a uniform to a punctuate plasma membrane distribution after antigen activation. (A) Distribution of fluorescently labeled IgE before and after antigen activation. Confocal image of a midsection through an RBL-cell before (left) and 3 min after (right) stimulation with the 500 ng/ml of antigen (DNP-BSA). (B) Line intensity profiles of the plasma membrane fluorescence intensity are shown for the two images. Bar, 10 μm.
Figure 7
Time course of association of fluorescently marked IgE receptor with glycosphingolipid-rich microdomains after antigen addition. (A) Comparison of the distributions of IgE receptors and cholera toxin B. Overlay images of IgE receptor (red) and cholera toxin B (green) are shown as a function of time after stimulation with 500 ng/ml antigen. (Left) Minimal colocalization is observed before antigen activation. (Middle) A significant overlap of IgE receptor and cholera toxin B is observed after 3 min. (Right) The colocalization is reduced 10 min after activation. Yellow shows increased overlap in cholera toxin B and IgE distribution while the red regions show the IgE receptor distributed elsewhere. (B) Correlation analysis between cholera toxin B distribution before and 3 min after activation (average of four cells). (C) Time course of the increase and subsequent decrease of the correlation peak amplitudes. Data are expressed as the mean of replicate samples from at least six cells ± SD. The dotted line corresponds to the cross correlation peak value of the PH domain with cholera toxin B. Maximal colocalization of IgE receptors with glycosphingolipid-rich membrane compartments is observed 2–4 min after activation.
Similar articles
- Downstream signaling molecules bind to different phosphorylated immunoreceptor tyrosine-based activation motif (ITAM) peptides of the high affinity IgE receptor.
Kimura T, Kihara H, Bhattacharyya S, Sakamoto H, Appella E, Siraganian RP. Kimura T, et al. J Biol Chem. 1996 Nov 1;271(44):27962-8. doi: 10.1074/jbc.271.44.27962. J Biol Chem. 1996. PMID: 8910399 - SH2 domain-mediated targeting, but not localization, of Syk in the plasma membrane is critical for FcepsilonRI signaling.
Sada K, Zhang J, Siraganian RP. Sada K, et al. Blood. 2001 Mar 1;97(5):1352-9. doi: 10.1182/blood.v97.5.1352. Blood. 2001. PMID: 11222380 - Protein tyrosine kinase Syk in mast cell signaling.
Siraganian RP, Zhang J, Suzuki K, Sada K. Siraganian RP, et al. Mol Immunol. 2002 Sep;38(16-18):1229-33. doi: 10.1016/s0161-5890(02)00068-8. Mol Immunol. 2002. PMID: 12217388 Review. - Structure and function of Syk protein-tyrosine kinase.
Sada K, Takano T, Yanagi S, Yamamura H. Sada K, et al. J Biochem. 2001 Aug;130(2):177-86. doi: 10.1093/oxfordjournals.jbchem.a002970. J Biochem. 2001. PMID: 11481033 Review.
Cited by
- A balance between positive and negative signals in cytotoxic lymphocytes regulates the polarization of lipid rafts during the development of cell-mediated killing.
Lou Z, Jevremovic D, Billadeau DD, Leibson PJ. Lou Z, et al. J Exp Med. 2000 Jan 17;191(2):347-54. doi: 10.1084/jem.191.2.347. J Exp Med. 2000. PMID: 10637278 Free PMC article. - Impaired FcεRI stability, signaling, and effector functions in murine mast cells lacking glycosylphosphatidylinositol-anchored proteins.
Hazenbos WL, Wu P, Eastham-Anderson J, Kinoshita T, Brown EJ. Hazenbos WL, et al. Blood. 2011 Oct 20;118(16):4377-83. doi: 10.1182/blood-2011-02-338053. Epub 2011 Aug 24. Blood. 2011. PMID: 21865342 Free PMC article. - Design and evaluation of engineered protein biosensors for live-cell imaging of EGFR phosphorylation.
Tiruthani K, Mischler A, Ahmed S, Mahinthakumar J, Haugh JM, Rao BM. Tiruthani K, et al. Sci Signal. 2019 Jun 4;12(584):eaap7584. doi: 10.1126/scisignal.aap7584. Sci Signal. 2019. PMID: 31164479 Free PMC article. - Differential role of glycolipid-enriched membrane domains in glycoprotein VI- and integrin-mediated phospholipase Cgamma2 regulation in platelets.
Wonerow P, Obergfell A, Wilde JI, Bobe R, Asazuma N, Brdicka T, Leo A, Schraven B, Horejsí V, Shattil SJ, Watson SP. Wonerow P, et al. Biochem J. 2002 Jun 15;364(Pt 3):755-65. doi: 10.1042/BJ20020128. Biochem J. 2002. PMID: 12049640 Free PMC article. - High resolution mapping of mast cell membranes reveals primary and secondary domains of Fc(epsilon)RI and LAT.
Wilson BS, Pfeiffer JR, Surviladze Z, Gaudet EA, Oliver JM. Wilson BS, et al. J Cell Biol. 2001 Aug 6;154(3):645-58. doi: 10.1083/jcb.200104049. J Cell Biol. 2001. PMID: 11489921 Free PMC article.
References
- Apgar JR. Antigen-induced cross-linking of the IgE receptor leads to an association with the detergent-insoluble membrane skeleton of rat basophilic leukemia (RBL-2H3) cells. J Immunol. 1990;145:3814–3822. - PubMed
- Benhamou M, Ryba NJ, Kihara H, Nishikata H, Siraganian RP. Protein-tyrosine kinase p72syk in high affinity IgE receptor signaling. Identification as a component of pp72 and association with the receptor γ chain after receptor aggregation. J Biol Chem. 1993;268:23318–23324. - PubMed
- Choi OH, Lee JH, Kassessinoff T, Cunha-Melo JR, Jones SV, Beaven MA. Antigen and carbachol mobilize calcium by similar mechanisms in a transfected mast cell line (RBL-2H3 cells) that expresses ml muscarinic receptors. J Immunol. 1993;151:5586–5595. - PubMed
- Crameri A, Whitehorn EA, Tate E, Stemmer PC. Improved green fluorescent protein by molecular evolution using DNA shuffling. Nat Biotechnol. 1996;14:315–319. - PubMed
- Eiseman E, Bolen JB. Engagement of the high-affinity IgE receptor activates src protein-related tyrosine kinases. Nature. 1992;355:78–80. - PubMed
Publication types
MeSH terms
Substances
LinkOut - more resources
Full Text Sources
Other Literature Sources
Miscellaneous


