Influence of PDGF-BB on proliferation and transition through the MyoD-myogenin-MEF2A expression program during myogenesis in mouse C2 myoblasts - PubMed (original) (raw)
Influence of PDGF-BB on proliferation and transition through the MyoD-myogenin-MEF2A expression program during myogenesis in mouse C2 myoblasts
Z Yablonka-Reuveni et al. Growth Factors. 1997.
Abstract
We have previously demonstrated that PDGF-BB enhances proliferation of C2 myoblasts. This has led us to examine whether the mitogenic influence of PDGF-BB in the C2 model correlates with modulation of specific steps associated with myogenic differentiation. C2 myoblasts transiting through these differentiation specific steps were monitored via immunocytochemistry. We show that the influence of PDGF on enhancing cell proliferation correlates with a delay in the emergence of cells positive for sarcomeric myosin. We further monitored the influence of PDGF-BB on differentiation steps preceding the emergence of myosin+ cells. We demonstrate that mononucleated C2 cells first express MyoD (MyoD+/myogenin- cells) and subsequently, myogenin. Cells negative for both MyoD and myogenin (the phenotype preceding the MyoD+ state) were present at all times in culture and comprised the majority, if not all, of the cells which responded mitogenically to PDGF. Additionally, the frequency of the MyoD+/myogenin+ cell phenotype was reduced in cultures receiving PDGF, suggesting that PDGF can modulate the transition of the cells into the myogenin+ state. We determined that many of the myogenin+ cells subsequently become MEF2A+ and this phenomenon is not influenced by PDGF-BB. FGF-2 also enhanced the proliferation of C2 myoblasts and suppressed the appearance of the myogenin+ cells, but did not influence the subsequent transition into the MEF2A+ state. The study raises the possibility that PDGF-BB and FGF-2 might delay the transition of the C2 cells into the MyoD+/myogenin+ state by depressing a paracrine signal that enhances differentiation.
Figures
FIGURE 1
Quantification of total cell numbers, the number of BrdU+ cells and the number of myosin+ cells when C2 myoblasts are maintained in 2% FCS ±PDGF. ‘Lower density’ cultures (lower panels) were initiated at 2.4 × 10⁴ cells/plate and ‘higher density’ cultures (upper panels) were initiated at 4 fold higher density. Cultures were initiated in the serum-rich, proliferation medium and 24 hours later switched into medium consisting of 2% FCS ±PDGF which was replaced daily; BrdU was administrated to the culture medium during the last 2 hours before fixation. Cultures were doubly labeled with antibodies against BrdU and myosin. Total cell numbers reflect the total number of nuclei including nuclei in myotubes (when myotubes are present). The number of myosin+ cells also reflects the number of nuclei in both mononucleated cells and myotubes. The height of the y-axis used for presenting the number of myosin+ cells in the higher and the lower density cultures was chosen in order to maintain the same ratio used for graphing the total cell numbers. Each analysis is based on the average of two parallel plates analyzing five microscopic fields per plate using a 25x objective. Note that in all other experiments we used a 40x objective counting at least ten microscopic fields; the area of one microspic field observed with the 25x objectives is about 2.5 fold larger than the area of a field observed with a 40x objective.
FIGURE 2
Frequency of mononucleated cells positive for MyoD and/or myogenin and of cells fused into myotubes in C2 cultures initiated at ‘higher density’ and reacted via double immunofluorescene with antibodies against MyoD and myogenin. Frequencies are based on the data summarized in Table I. Note that except for the graphs summarizing the frequency of nuclei in myotubes and the frequency of cells with a myogenic phenotype (panels D and H) all other graphs demonstrating frequency of cells represent mononucleated cells only.
FIGURE 3
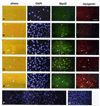
Micrographs demonstrating large clones doubly stained with antibodies against MyoD and myogenin along with DAPI stain of the nuclei (A–E) and an over view of a large clone at lower magnification (F–G). Clones were initiated in proliferation medium and switched following 5 days into medium consisting of 2% FCS (±PDGF). Reactivity with the anti-MyoD polyclonal antibody was visualized with a fluorescein-conjugated secondary antibody and reactivity with the anti-myogenin monoclonal antibody was visualized with a rhodamine-conjugated secondary antibody. (A) Micrographs of the outer region of a large clone whose center is already positive for MyoD and myogenin; culture was maintained for 2 days in the 2% FCS medium (+PDGF). (B–D) Micrographs of central regions of different large clones; cultures were maintained for 2 days in the 2% FCS medium (PDGF was present in B and C and absence in D). (E) Micrographs of the central region of a large clone showing small myotubes; the culture was maintained for 3 days in the 2% FCS medium in the presence of PDGF. (F–G) Lower magnification micrographs of a large clone shown to provide an overview of the density of the cells in (F) the more peripheral region of the clone and (G) the more central region of the clone; culture was maintained for 2 days in the 2% FCS medium with PDGF; nearly all cells in the region shown in panel G were found positive for MyoD, in contrast most cells in the periphery of the region shown in panel F were negative for MyoD. Arrowheads in parallel micrographs mark the position of the cells positive for MyoD but negative for myogenin, larger arrows mark the position of cells positive for both MyoD and myogenin and smaller arrows mark the position of cells negative for both MyoD and myogenin. Micrographs in panels A–E were taken with a 40x objective; bar, 57 µm. Micrographs in panels F–G were taken with a 16x objective; bar 146 µm.
FIGURE 4
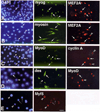
Micrographs demonstrating C2 cultures which were immunoreacted with various combinations of mouse monoclonal and rabbit polyclonal antibodies and counter stained with DAPI. Panel A — reactivity with a monoclonal antibody against myogenin and a polyclonal antibody against MEF2A. Panel B — reactivity with a monoclonal antibody against myosin and a polyclonal antibody against MEF2A. Panel C — reactivity with a monoclonal antibody against MyoD and a polyclonal antibody against cyclin A. Panel D — reactivity with a monoclonal antibody against desmin and a polyclonal antibody against MyoD. Panel E — reactivity with a polyclonal antibody against Myf5. Reactivity with the monoclonal antibodies was visualized with a fluorescein-labeled secondary antibody and reactivity with the polyclonal antibodies was visualized with a rhodamine-labeled secondary antibody. Cultures were initiated in proliferation medium and switched following 24 hours into medium consisting of 2% PCS in MEM (±PDGF). The different panels represent cultures fixed following 1 to 4 days in culture. Arrows in parallel DAPI and immunofluorescent micrographs in panels A through D mark the position of cells positive for both antibodies examined while arrowheads in these panels mark the position of cells which are positive for only one of the two antibodies examined. Arrows and arrowheads in the parallel micrographs in panel E mark the position of cells whose cytoplasm or nuclei, respectively, is immunopositive for the antibody tested. Micrographs in all panels were taken with a 40x objective.
Similar articles
- The transition from proliferation to differentiation is delayed in satellite cells from mice lacking MyoD.
Yablonka-Reuveni Z, Rudnicki MA, Rivera AJ, Primig M, Anderson JE, Natanson P. Yablonka-Reuveni Z, et al. Dev Biol. 1999 Jun 15;210(2):440-55. doi: 10.1006/dbio.1999.9284. Dev Biol. 1999. PMID: 10357902 Free PMC article. - MyoD and myogenin expression patterns in cultures of fetal and adult chicken myoblasts.
Yablonka-Reuveni Z, Paterson BM. Yablonka-Reuveni Z, et al. J Histochem Cytochem. 2001 Apr;49(4):455-62. doi: 10.1177/002215540104900405. J Histochem Cytochem. 2001. PMID: 11259448 - Proliferation and differentiation of human fetal myoblasts is regulated by PDGF-BB.
Jin P, Farmer K, Ringertz NR, Sejersen T. Jin P, et al. Differentiation. 1993 Aug;54(1):47-54. doi: 10.1111/j.1432-0436.1993.tb00658.x. Differentiation. 1993. PMID: 8405773 - Fibroblast growth factor promotes recruitment of skeletal muscle satellite cells in young and old rats.
Yablonka-Reuveni Z, Seger R, Rivera AJ. Yablonka-Reuveni Z, et al. J Histochem Cytochem. 1999 Jan;47(1):23-42. doi: 10.1177/002215549904700104. J Histochem Cytochem. 1999. PMID: 9857210 - [Interactions of proliferation and differentiation signaling pathways in myogenesis].
Milewska M, Grabiec K, Grzelkowska-Kowalczyk K. Milewska M, et al. Postepy Hig Med Dosw (Online). 2014 May 8;68:516-26. doi: 10.5604/17322693.1101617. Postepy Hig Med Dosw (Online). 2014. PMID: 24864103 Review. Polish.
Cited by
- Inhibition of myotube formation by platelet-derived growth factor subunit B in QM7 cells.
Choi S, Shin S. Choi S, et al. Anim Biosci. 2025 Jan;38(1):157-165. doi: 10.5713/ab.24.0262. Epub 2024 Aug 23. Anim Biosci. 2025. PMID: 39210814 Free PMC article. - CC family chemokines directly regulate myoblast responses to skeletal muscle injury.
Yahiaoui L, Gvozdic D, Danialou G, Mack M, Petrof BJ. Yahiaoui L, et al. J Physiol. 2008 Aug 15;586(16):3991-4004. doi: 10.1113/jphysiol.2008.152090. Epub 2008 Jun 19. J Physiol. 2008. PMID: 18566004 Free PMC article. - Defining the transcriptional signature of skeletal muscle stem cells.
Yablonka-Reuveni Z, Day K, Vine A, Shefer G. Yablonka-Reuveni Z, et al. J Anim Sci. 2008 Apr;86(14 Suppl):E207-16. doi: 10.2527/jas.2007-0473. Epub 2007 Sep 18. J Anim Sci. 2008. PMID: 17878281 Free PMC article. Review. - Neural cell integration into 3D bioprinted skeletal muscle constructs accelerates restoration of muscle function.
Kim JH, Kim I, Seol YJ, Ko IK, Yoo JJ, Atala A, Lee SJ. Kim JH, et al. Nat Commun. 2020 Feb 24;11(1):1025. doi: 10.1038/s41467-020-14930-9. Nat Commun. 2020. PMID: 32094341 Free PMC article. - ELAVL1 modulates transcriptome-wide miRNA binding in murine macrophages.
Lu YC, Chang SH, Hafner M, Li X, Tuschl T, Elemento O, Hla T. Lu YC, et al. Cell Rep. 2014 Dec 24;9(6):2330-43. doi: 10.1016/j.celrep.2014.11.030. Epub 2014 Dec 18. Cell Rep. 2014. PMID: 25533351 Free PMC article.
References
- Allen RD, Rankin LL, Greene EA, Boxhorn LK, Johnson SE, Taylor RG, Pierce PR. Desmin is present in proliferating rat muscle satellite cells but not in bovine muscle satellite cells. J. Cell. Physiol. 1991;149:525–535. - PubMed
- Canalis E, Gabbitas B. Skeletal growth factors regulate the synthesis of insulin-like growth factor binding protein-5 in bone cell culture. J. Biol. Chem. 1995;270:10771–10776. - PubMed
Publication types
MeSH terms
Substances
LinkOut - more resources
Full Text Sources
Miscellaneous


