Identification of semaphorin E as a non-MDR drug resistance gene of human cancers - PubMed (original) (raw)
Identification of semaphorin E as a non-MDR drug resistance gene of human cancers
T Yamada et al. Proc Natl Acad Sci U S A. 1997.
Abstract
To improve cancer chemotherapy, a better understanding of the molecular mechanisms of drug resistance is essential. To identify the molecules responsible for drug resistance that is unrelated to MDR1 or MRP gene products, a eukaryotic expression cDNA library of cis-diamminedichloroplatinum(II) (CDDP)-resistant ovarian cancer TYKnuR cells was introduced into Cos-7 cells. After repeated CDDP selection, cDNA homologous to murine semaphorin E was isolated from surviving cells. Human semaphorin E (H-sema E) was overexpressed in CDDP-resistant cell lines and was readily induced not only by diverse chemotherapeutic drugs but also by x-ray and UV irradiation. Transfection of H-sema E conferred a drug-resistant phenotype to CDDP-sensitive cells. In addition, the aberrant expression of H-sema E protein was detected immunohistochemically in 14 of 42 (33.3%) recurrent squamous cell carcinomas removed at autopsy after extensive radiochemotherapy. Recently, another member of the semaphorin family, CD100, was shown to significantly improve the viability of B lymphocytes. These results suggest the involvement of semaphorins in diverse cell survival mechanisms.
Figures
Figure 1
Molecular cloning of H-sema E. (a) A cDNA library of CDDP-resistant TYKnuR cells was introduced into Cos-7 cells, which then were exposed to CDDP. Pooled cDNA inserts were amplified by PCR after each round of CDDP selection. After the fifth round of CDDP selection, two cDNA clones with inserts of 1.1 and 1.0 kb were prominent (arrowheads). Amplified fragments of approximately 200 bp were derived from plasmids without inserts (lanes 0–4, indicated by ⧫). MW, 100-bp ladder (Pharmacia Biotech). (b) Predicted amino acid sequence of H-sema E in alignment with mouse semaphorin E (21). The conserved semaphorin domain is given in a line box. The putative signal sequence is underlined. Identical amino acids are eliminated from the mouse semaphorin E sequence. Bars correspond to gaps introduced into the sequences to optimize alignment. (c) Expression of H-sema E mRNA in normal adult human tissues. Human multiple tissue Northern blots I and II (CLONTECH) were hybridized with H-sema E cDNA: lane A, pancreas; lane B, kidney; lane C, skeletal muscle; lane D, liver; lane E, lung; lane F, placenta; lane G, brain; lane H, heart; lane I, peripheral blood leukocytes; lane J, colon; lane K, small intestine; lane L, ovary; lane M, testis; lane N, prostate; lane O, thymus; lane P, spleen. (d) In vitro translation analysis of H-sema E. H-sema E cDNA (lane 2) and control plasmid DNA (lane 1) was transcribed and translated in vitro and analyzed by SDS/PAGE and autoradiography (23).
Figure 2
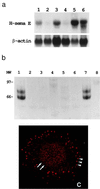
Overexpression of H-sema E in CDDP-resistant cancer cell lines. (a) Northern blot analysis of H-sema E expression. H-sema E expression was stronger in CDDP-resistant cells (Upper), TYKnuR (lane 1), Lu65/CDDP (lane 3), and MS-1/CDDP (lane 5), than in the CDDP-sensitive parent cells, TYKnu (lane 2), Lu65 (lane 4), and MS-1 (lane 6). The quality and quantity of electrophoresed mRNA was determined by rehybridization of the same blot with β-actin cDNA (Lower). (b) Immunoprecipitation analysis of secreted H-sema E protein. Radio-labeled cell-free conditioned media from Cos-7 cells transfected with H-sema E cDNA (lanes 1 and 2), Cos-7 cells transfected with vector alone (lanes 3 and 4), CDDP-sensitive TYKnu cells (lanes 5 and 6), and CDDP-resistant TYKnuR cells (lanes 7 and 8) were immunoprecipitated with anti-H-sema E antibody (lanes 1, 3, 5, and 7) or normal rabbit IgG (lanes 2, 4, 6, and 8). (c) Laser scanning confocal immunofluorescence microscopy showing the subcellular localization of H-sema E protein in a CDDP-resistant TYKnuR cell. Dot-like staining of H-sema E in the periphery of the cytoplasm (arrowheads) and diffuse fine granular staining in the entire nucleus (arrows) are evident.
Figure 3
Induction of H-sema E mRNA in CDDP-sensitive cells. (a) Induction of H-sema E in CDDP-sensitive TYKnu cells by CDDP treatment. TYKnu cells were treated for 3 days with 0.0 (untreated control, lane 3), 0.1 (lane 4), 0.3 (lane 5), or 1.0 (lane 6) μg/ml CDDP. The constitutive expression of H-sema E by CDDP-resistant TYKnuR cells (lane 1) was not affected by the 3-day treatment with 1.0 μg/ml CDDP (lane 2). The relative intensity of the blots compared with lane 3 was 5.4 (lane 1), 6.3 (lane 2), 0.2 (lane 4), 1.5 (lane 5), and 4.3 (lane 6). (b) Time-dependent induction of H-sema E in CDDP-sensitive Lu65 cells. Lu65 cells were untreated or treated with 2.0 μg/ml CDDP for 6 to 72 hr (hereafter, lanes marked “0” represent untreated controls). The relative intensity of the blots compared with the untreated control was 1.1 (6 hr), 1.0 (24 hr), 2.0 (48 hr), and 3.7 (72 hr). (c) Dose-dependent induction of H-sema E in CDDP-sensitive Lu65 cells by the platinum-containing compounds, CBDCA and CDDP. H-sema E was induced in a dose-dependent manner by 3-day treatment with 3–30 μg/ml CBDCA or 0.5–2.0 μg/ml CDDP. The relative intensity of the blots compared with the untreated controls was 1.8 (3 μg/ml CBDCA), 1.8 (10 μg/ml CBDCA), 3.4 (30 μg/ml CBDCA), 1.2 (0.5 μg/ml CDDP), 2.9 (1.0 μg/ml CDDP), and 5.7 (2.0 μg/ml CDDP). (d) Induction of H-sema E in CDDP-sensitive Lu65 cells by non-platinum-containing anti-cancer compounds. H-sema E was induced by 3-day treatment with 0.1 and 0.2 μg/ml MMC, 0.1 μg/ml ADM, and 1.0 μg/ml VP-16. The relative intensity of the blots compared with the untreated controls was 2.2 (0.1 μg/ml MMC), 2.7 (0.2 μg/ml MMC), 2.9 (0.1 μg/ml ADM), and 3.1 (1.0 μg/ml VP-16). (e) Time- and dose-dependent induction of H-sema E in CDDP-sensitive Lu65 cells by UV irradiation. Total RNA was extracted from Lu65 cells 3 days after UV irradiation at 20, 40, or 80 J/m2 (Left), or 24, 48, or 72 hr after UV irradiation at 80 J/m2 (Right). The relative intensity of the blots compared with the untreated controls was 1.1 (20 J/m2), 1.5 (40 J/m2), 2.5 (80 J/m2), 0.6 (24 hr), 2.0 (48 hr), and 3.2 (72 hr). (f) Induction of H-sema E in CDDP-sensitive Lu65 cells by x-ray irradiation. Total RNA was extracted from Lu65 cells 3 days after irradiation at a dose of 3 or 10 Gy. The relative intensity of the blots compared with the untreated control was 0.7 (3 Gy) and 3.9 (10 Gy).
Figure 4
Stable transfection of H-sema E cDNA into CDDP-sensitive TYKnu cells. (a) Northern blotting of H-sema E in transfectants. Three stable G418-resistant clones with different expression levels of H-sema E (lane 2, C11; lane 3, C28; and lane 4, E15) and one clone transfected with vector alone (mock transfectant, lane 1, D8) were selected by Northern blotting. (b) Sensitivity of H-sema E transfectants (C11, C28, and E15) and a mock transfectant (D8) to CDDP.
Figure 5
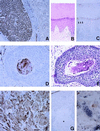
Immunohistochemical detection of H-sema E protein in human tissues. (A) Immunoperoxidase staining of H-sema E in Schwann cells of a peripheral nerve (Left) and the spinal cord (Right). (B) Hematoxylin and eosin staining of skin from the foot showing keratinization. (C) Immunoperoxidase staining of H-sema E in a section adjacent to the section shown in B. (D) Immunoperoxidase staining of H-sema E in a nest of an untreated pharyngeal cancer. Only parakeratotic cancer cells in the center of the nest are stained. (E) Hematoxylin and eosin staining of a section adjacent to the section shown in D. (F) Immunoperoxidase staining of H-sema E in a recurrent tumor taken from the same patient as the tissue in D. (G) Immunoperoxidase staining of H-sema E in untreated lung cancer with coagulation necrosis (∗). (H) Immunoperoxidase staining of H-sema E in bizarre giant cells in a recurrent lung cancer after treatment.
Similar articles
- Correlation of MDR-1, nm23-H1 and H Sema E gene expression with histopathological findings and clinical outcome in ovarian and breast cancer patients.
Galani E, Sgouros J, Petropoulou C, Janinis J, Aravantinos G, Dionysiou-Asteriou D, Skarlos D, Gonos E. Galani E, et al. Anticancer Res. 2002 Jul-Aug;22(4):2275-80. Anticancer Res. 2002. PMID: 12174914 - [Comparison of stepwise and pulse induced cisplatin-resistant ovarian cancer cell sublines].
Cheng G, Li Y, Tian F. Cheng G, et al. Zhonghua Zhong Liu Za Zhi. 2001 Jul;23(4):305-8. Zhonghua Zhong Liu Za Zhi. 2001. PMID: 11783113 Chinese. - Differentially expressed genes associated with cisplatin resistance in human ovarian adenocarcinoma cell line A2780.
Solár P, Sytkowski AJ. Solár P, et al. Cancer Lett. 2011 Oct 1;309(1):11-8. doi: 10.1016/j.canlet.2011.05.008. Epub 2011 Jun 14. Cancer Lett. 2011. PMID: 21676537 - [Gene expression profiling of human ovarian epithelial tumors by digo nucleotide microarray].
Konno R. Konno R. Hum Cell. 2001 Dec;14(4):261-6. Hum Cell. 2001. PMID: 11925926 Review. Japanese.
Cited by
- The evaluative value of Sema3C and MFN2 co-expression detected by immunohistochemistry for prognosis in hepatocellular carcinoma patients after hepatectomy.
Feng X, Zhu K, Liu J, Chen J, Tang J, Liang Y, Jin R, Liang X, Cai X. Feng X, et al. Onco Targets Ther. 2016 May 30;9:3213-21. doi: 10.2147/OTT.S98322. eCollection 2016. Onco Targets Ther. 2016. PMID: 27313467 Free PMC article. - The cleavage of semaphorin 3C induced by ADAMTS1 promotes cell migration.
Esselens C, Malapeira J, Colomé N, Casal C, Rodríguez-Manzaneque JC, Canals F, Arribas J. Esselens C, et al. J Biol Chem. 2010 Jan 22;285(4):2463-73. doi: 10.1074/jbc.M109.055129. Epub 2009 Nov 13. J Biol Chem. 2010. PMID: 19915008 Free PMC article. - Targeting Semaphorin 3C in Prostate Cancer With Small Molecules.
Lee CCW, Munuganti RSN, Peacock JW, Dalal K, Jiao IZF, Shepherd A, Liu L, Tam KJ, Sedgwick CG, Bhasin S, Lee KCK, Gooding L, Vanderkruk B, Tombe T, Gong Y, Gleave ME, Cherkasov A, Ong CJ. Lee CCW, et al. J Endocr Soc. 2018 Oct 11;2(12):1381-1394. doi: 10.1210/js.2018-00170. eCollection 2018 Dec 1. J Endocr Soc. 2018. PMID: 30534631 Free PMC article. - The leukocyte semaphorin CD100 is expressed in most T-cell, but few B-cell, non-Hodgkin's lymphomas.
Dorfman DM, Shahsafaei A, Nadler LM, Freeman GJ. Dorfman DM, et al. Am J Pathol. 1998 Jul;153(1):255-62. doi: 10.1016/S0002-9440(10)65566-6. Am J Pathol. 1998. PMID: 9665486 Free PMC article.
References
- Lippard S J. Pure Appl Chem. 1987;59:731–742.
- Loeherer P J, Einhorn L H. Ann Intern Med. 1984;100:704–713. - PubMed
- Rosenberg B. Cancer (Phila) 1985;55:2303–2316. - PubMed
- Andrew P A, Howell S B. Cancer Cells. 1990;2:35–43. - PubMed
- Doyle L A. Semin Oncol. 1993;20:326–337. - PubMed
Publication types
MeSH terms
Substances
LinkOut - more resources
Full Text Sources
Other Literature Sources
Medical
Molecular Biology Databases
Research Materials


