Whole-cell plasticity in cocaine withdrawal: reduced sodium currents in nucleus accumbens neurons - PubMed (original) (raw)
Whole-cell plasticity in cocaine withdrawal: reduced sodium currents in nucleus accumbens neurons
X F Zhang et al. J Neurosci. 1998.
Abstract
The nucleus accumbens is a forebrain region that mediates cocaine self-administration and withdrawal effects in animal models of cocaine dependence. Considerable evidence suggests an important role of dopamine D1 receptors in these effects. Using a combination of current-clamp recordings in brain slices and whole-cell patch-clamp recordings from freshly dissociated neurons, we found that nucleus accumbens neurons are less excitable in cocaine withdrawn rats because of a novel form of plasticity: reduced whole-cell sodium currents. Three days after discontinuation of repeated cocaine injections, nucleus accumbens neurons recorded in brain slices were less responsive to depolarizing current injections, had higher action potential thresholds, and had lower spike amplitudes. Freshly dissociated nucleus accumbens neurons from cocaine-pretreated rats exhibited diminished sodium current density and a depolarizing shift in the voltage-dependence of sodium channel activation. These effects appear to be related to enhanced basal phosphorylation of sodium channels because of increased transmission through the dopamine D1 receptor/cAMP-dependent protein kinase pathway. The effects of repeated cocaine administration were not mimicked by repeated injections of the local anesthetic lidocaine and were not observed in neurons within the motor cortex, indicating that they did not result from local anesthetic actions of cocaine. Because nucleus accumbens neurons are normally recruited to coordinate response patterns of movement and affect, the decreased excitability during cocaine withdrawal may be related to symptoms such as anergia, anhedonia, and depression.
Figures
Fig. 1.
Repeated cocaine administration reduces action potential amplitudes of NAc neurons. Representative traces showing action potentials recorded from NAc neurons in saline-pretreated and cocaine-pretreated rats on the third day of withdrawal. Note the reduced amplitude of the action potential in the cocaine-pretreated neuron. The traces are normalized for action potential thresholds, which were −40.2 mV in the control neuron and −45.0 mV in the cocaine neuron. Resting membrane potentials were −79 mV for control and −86 mV for cocaine. Action potentials were evoked with intracellular depolarizing current injection (0.7 and 0.9 nA for saline and cocaine, respectively).
Fig. 2.
Stimulation of dopamine D1 receptors suppresses whole-cell Na+ currents in NAc neurons. Current traces (inset) and time course showing that the D1 receptor selective agonist SKF 38393 (1 μ
m
) reversibly suppressed whole-cell Na+ current in an untreated NAc neuron. The effect was observed in 33/40 neurons tested (mean ± SEM = 24.5 ± 2.1% suppression; see Fig. 8 for concentration–effect curves). The dopamine D1 receptor-selective antagonist SCH 23390 (1 μ
m
) completely prevented the suppression of current by SKF 38393 (n = 6). Currents were evoked by stepping the membrane from the holding potential of −70 mV to the test potential of −20 mV (see_protocol above traces_) where Na+current was near-maximal (I–V tests not shown). Na+ currents were completely prevented by tetrodotoxin (1–2 μ
m
; not shown), exhibited a reversal potential of ∼50 mV, and inactivated rapidly. The_number_ associated with each trace indicates the point during the time course at which the trace was obtained.
Fig. 3.
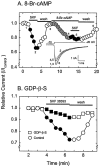
The D1 agonist-induced suppression of Na+ current involves Gs protein activation of cAMP. A, This combination of time plot and current traces (inset) shows that the suppression produced by SKF 38393 was mimicked by the membrane-permeable cAMP analog 8-Br-cAMP (50 μ
m
;n = 6; 37.3 ± 10.6% suppression), which also occluded the effect of SKF 38393. B, These time–response curves compare the suppression of Na+currents by SKF 38393 in a control neuron and a neuron that had been dialyzed with the nonhydrolyzable GDP analog_GDP_-β-S, which prevents activation of Gs proteins. Note the marked reduction in the efficacy of SKF 38393 (2.8 ± 1.4% suppression; n = 7).
Fig. 4.
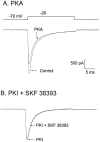
The D1 agonist-induced suppression of Na+ currents involves cyclic-AMP-dependent protein kinase (PKA). A, The suppression of Na+ current by D1 agonists was mimicked by the catalytic subunit of PKA (50–100 U/ml; n = 8), which was dialyzed into the neurons through the patch pipette. Na+ current reduction was observed 4 min after membrane seal rupture. B, The PKA inhibitor_PKI_ [5–24] (10 μ
m
) prevented the suppression of Na+ current by SKF 38393 after 4 min of dialysis into the neuron (n = 9).
Fig. 5.
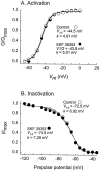
D1 agonist-induced suppression of Na+ current occurred without alterations in the voltage dependence of activation or inactivation. A, The voltage-dependence of activation of whole-cell Na+current was not altered by SKF 38393. Relative conductance is plotted as a function of test potential. Activation curves were determined by voltage-clamping cells at −70 mV and applying voltage steps to potentials of −70 to +60 mV. To ensure that channel inactivation was removed completely, a lower frequency (0.1–0.2 Hz) was used. Peak currents were obtained at every test potential. Conductance was derived according to the equation _G_Na =_I_Na,peak/(V −_V_Na), where_G_Na is conductance,_I_Na,peak is peak Na+current, V is test potential, and_V_Na is the Na+ reversal potential. The steady-state activation curves (_m_-curve) were determined by plotting_G_Na/G_Na,maxversus membrane potential as the Boltzmann equation_m = [1 + exp _(V − V_½)/_k_] − 1 where_V_½ is the midpoint of the_m_-curves and k is the curve slope factor.B, The voltage dependence of inactivation was not altered by SKF 38393. Relative current is plotted as a function of prepulse potential. Steady-state inactivation curves were determined with a conditioning prepulse protocol. Cells were voltage-clamped at −70 mV. Membrane potential was first stepped (prepulse) to potentials from −120 to −40 mV (200 msec duration) before evoking Na+ currents with a step to −20 mV. The steady-state inactivation curves (_h_-curves;h = _I_Na, peak/_I_Na,max vs conditioning potential) were fitted to a Boltzmann equation h = [1 + exp (V −_V_½)/_k_] − 1, where_V_½ is the half-point of the inactivation curve and k is the slope factor. Time constants for inactivation were obtained by fitting traces to a single exponential.
Fig. 6.
Repeated cocaine treatment reduced NAc Na+ currents and caused a depolarizing shift in the voltage dependence of activation. A, NAc neurons (n = 33) from cocaine-pretreated rats exhibited significantly (t_68 = 2.75;p = 0.0075) reduced peak whole-cell Na+ currents (measured at −20 mV) as compared with neurons (n = 37) obtained from saline-pretreated rats. Results are presented as current density to normalize for capacitance (see Results). B, Recordings showing_I–V relationship for Na+ currents in a control and a cocaine-pretreated NAc neuron. C, Plots of the I–V curves for the two neurons shown in_B. D_, Cocaine pretreatment caused a depolarizing shift in the voltage dependence of activation and reduced the slope factor (k). Values were obtained for each neuron at each membrane voltage, and the mean ± SEM were plotted. Half-maximal activation (_V_1/2) and slope (k) values were obtained individually for each neuron and compared with t tests. Half-maximal activation occurred at significantly (_t_28 = 2.26; p = 0.031) more depolarized potentials in cocaine-pretreated neurons (−40.3 ± 1.8 mV;n = 16) as compared with saline-pretreated neurons (46.1 ± 1.2; n = 14). The slope factor was also significantly decreased (_t_28 = 3.13;p = 0.004) in the cocaine group (8.85 ± 0.8) as compared with the saline group (4.01 ± 0.8). Note that the_V_½ and k values shown in the figure were derived from the curves fitted to the mean values depicted in the figure, not from the mean values (given here) obtained by averaging all of the neurons in the sample.E, The voltage dependence of inactivation was not altered by repeated cocaine treatment. Values were obtained from the mean ± SEM as in B (n = 16 for cocaine; n = 13 for saline). Note that repeated administration of lidocaine failed to produce effects similar to those of cocaine: Na+ current density = 0.81 ± 0.058, n = 9; activation_V_½ = −42.4 ± 1.8,k = 5.2 ± 0.8, n = 8; and inactivation _V_½ = −60.6 ± 2.5, k = 7.0 ± 0.4, n = 9. None of these values was significantly different from control (t tests). See Figure 5 legend for details regarding activation and inactivation curves.
Fig. 7.
Phosphorylation of sodium channels by PKC decreased whole-cell Na+ current and slightly delayed inactivation. A, Administration of the PKC activator PMA (1 μ
m
) decreased peak Na+ current. B, The traces in_A_ have been rescaled such that current amplitude is normalized in the two conditions. This allows better detection of the slower inactivation in the presence of PMA. However, this effect was observed in only four of nine neurons. C, The voltage dependence of activation was not altered by PMA treatment (n = 3). D, The voltage dependence of inactivation was not altered by PMA treatment (_n_= 3). See Figure 5 legend for details of activation and inactivation curves.
Fig. 8.
D1 agonist-induced suppression of whole-cell Na+ current in NAc neurons is not altered by repeated cocaine administration. The ability of the DA D1 receptor-selective agonist SKF 38393 (0.1–10 μ
m
) to suppress whole-cell Na+ current was not significantly different (ANOVA) in NAc neurons recorded from cocaine-treated rats and saline-treated control rats. Sample sizes for the 0.1, 1.0, and 10.0 μ
m
concentrations of SKF 38393 are 6, 6, and 5 for both control and cocaine groups. In addition, another group of 30 cocaine pretreated neurons were tested with 1.0 μ
m
SKF 38393 and exhibited average inhibition of 27.2 ± 1.7%, a value that is not significantly different from that obtained in 33 untreated neurons (24.5 ± 2.1%), as described in Figure 2 legend (t test).
Comment in
- A behavioral/systems approach to the neuroscience of drug addiction.
White FJ. White FJ. J Neurosci. 2002 May 1;22(9):3303-5. doi: 10.1523/JNEUROSCI.22-09-03303.2002. J Neurosci. 2002. PMID: 11978803 Free PMC article. Review. No abstract available.
Similar articles
- Repeated cocaine exposure decreases dopamine D₂-like receptor modulation of Ca(2+) homeostasis in rat nucleus accumbens neurons.
Perez MF, Ford KA, Goussakov I, Stutzmann GE, Hu XT. Perez MF, et al. Synapse. 2011 Feb;65(2):168-80. doi: 10.1002/syn.20831. Synapse. 2011. PMID: 20665696 Free PMC article. - Neuroadaptations in nucleus accumbens neurons resulting from repeated cocaine administration.
White FJ, Hu XT, Zhang XF. White FJ, et al. Adv Pharmacol. 1998;42:1006-9. doi: 10.1016/s1054-3589(08)60917-5. Adv Pharmacol. 1998. PMID: 9328068 No abstract available. - Roles of nucleus accumbens CREB and dynorphin in dysregulation of motivation.
Muschamp JW, Carlezon WA Jr. Muschamp JW, et al. Cold Spring Harb Perspect Med. 2013 Feb 1;3(2):a012005. doi: 10.1101/cshperspect.a012005. Cold Spring Harb Perspect Med. 2013. PMID: 23293139 Free PMC article. Review.
Cited by
- Cocaine increases actin cycling: effects in the reinstatement model of drug seeking.
Toda S, Shen HW, Peters J, Cagle S, Kalivas PW. Toda S, et al. J Neurosci. 2006 Feb 1;26(5):1579-87. doi: 10.1523/JNEUROSCI.4132-05.2006. J Neurosci. 2006. PMID: 16452681 Free PMC article. - Block of a Ca(2+)-activated potassium channel by cocaine.
Premkumar LS. Premkumar LS. J Membr Biol. 2005 Apr;204(3):129-36. doi: 10.1007/s00232-005-0755-6. J Membr Biol. 2005. PMID: 16245035 - MeCP2 phosphorylation limits psychostimulant-induced behavioral and neuronal plasticity.
Deng JV, Wan Y, Wang X, Cohen S, Wetsel WC, Greenberg ME, Kenny PJ, Calakos N, West AE. Deng JV, et al. J Neurosci. 2014 Mar 26;34(13):4519-27. doi: 10.1523/JNEUROSCI.2821-13.2014. J Neurosci. 2014. PMID: 24671997 Free PMC article. - Ethanol Withdrawal Drives Anxiety-Related Behaviors by Reducing M-type Potassium Channel Activity in the Lateral Habenula.
Kang S, Li J, Zuo W, Fu R, Gregor D, Krnjevic K, Bekker A, Ye JH. Kang S, et al. Neuropsychopharmacology. 2017 Aug;42(9):1813-1824. doi: 10.1038/npp.2017.68. Epub 2017 Apr 7. Neuropsychopharmacology. 2017. PMID: 28387223 Free PMC article.
References
- Baxter DA, Bittner GD. Intracellular recordings from crustacean motor axons during presynaptic inhibition. Brain Res. 1981;223:422–428. - PubMed
- Beitner-Johnson D, Nestler EJ. Morphine and cocaine exert common chronic action on tyrosine hydroxylase in dopaminergic brain regions. J Neurochem. 1991;57:344–347. - PubMed
- Bonci A, Williams JT. A common mechanism mediates long-term changes in synaptic transmission after chronic cocaine and morphine. Neuron. 1996;16:631–639. - PubMed
- Catterall WA. Cellular and molecular biology of voltage-gated sodium channels. Physiol Rev. 1992;72:S15–S48. - PubMed
Publication types
MeSH terms
Substances
LinkOut - more resources
Full Text Sources


