Ripped pocket and pickpocket, novel Drosophila DEG/ENaC subunits expressed in early development and in mechanosensory neurons - PubMed (original) (raw)
Ripped pocket and pickpocket, novel Drosophila DEG/ENaC subunits expressed in early development and in mechanosensory neurons
C M Adams et al. J Cell Biol. 1998.
Abstract
Drosophila melanogaster has proven to be a good model for understanding the physiology of ion channels. We identified two novel Drosophila DEG/ ENaC proteins, Pickpocket (PPK) and Ripped Pocket (RPK). Both appear to be ion channel subunits. Expression of RPK generated multimeric Na+ channels that were dominantly activated by a mutation associated with neurodegeneration. Amiloride and gadolinium, which block mechanosensation in vivo, inhibited RPK channels. Although PPK did not form channels on its own, it associated with and reduced the current generated by a related human brain Na+ channel. RPK transcripts were abundant in early stage embryos, suggesting a role in development. In contrast, PPK was found in sensory dendrites of a subset of peripheral neurons in late stage embryos and early larvae. In insects, such multiple dendritic neurons play key roles in touch sensation and proprioception and their morphology resembles human mechanosensory free nerve endings. These results suggest that PPK may be a channel subunit involved in mechanosensation.
Figures
Figure 1
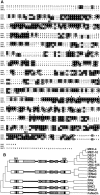
Sequence and alignment of PPK and RPK with other DEG/ENaC family members. (A) Amino acid sequence of PPK and RPK, and BNC1, their closest relative. Similar residues are indicated by shading. Transmembrane domains are indicated with solid bars. Diamonds indicate conserved cysteines. An asterisk indicates residue analogous to that which causes neurodegeneration in C. elegans when mutated. Hatched bars indicate residues of PPK encoded by the fourth exon of the ppk coding region. (B) The DEG/ENaC family. Sequence analysis indicates that the family can be divided into five subfamilies: C. elegans members (MEC-4, MEC-10, DEG-1, UNC-8, UNC-105, and DEL-1), mammalian ENaC subunits (α-, β-, and γENaC and δNaCh), mammalian neuronal channels (BNC1 and BNaC2), Drosophila PPK and RPK, and FaNaCh. Proteins are named as suggested in the first published report of their primary structure. DEG/ENaC proteins can also be classified by gross features of their extracellular regions. The schematic diagrams on the left represent a typical member from each subfamily (MEC-4, αENaC, PPK, BNC1, and FaNaCh), and show that members within each subfamily possess a characteristic extracellular domain not found in members of other subfamilies. Shading indicates regions containing sequences conserved in all DEG/ENaC proteins; checkered shading represents regions of conserved cysteines; black indicates the conserved transmembrane domains, M1 and M2; white indicates regions with poorly conserved sequences; hatched white bars indicates subfamily-specific extracellular domains. Note that within each subfamily there are some differences in length of the various domains.
Figure 2
Expression and Northern analysis of PPK. (A and B) COS-7 cells were transfected with cDNA encoding PPKmyc. Cell lysates were incubated overnight with or without endoglycosidase H, as indicated. Proteins were separated on 8% polyacrylamide gels, and detected by Western blot using either anti-myc antibody (A), or anti-PPK antibody (B). (C) Northern blot analysis of Drosophila embryonic, larval, and adult poly(A)+ RNA using a ppk probe. Exposure time was 36 h.
Figure 3
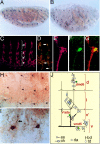
Embryonic expression pattern of PPK. (A and B) Late stage Drosophila embryos labeled with either an antisense ppk riboprobe (A, purple) or anti-PPK antibody (B, brown). (C) Peripheral neurons in five abdominal hemisegments labeled with antibody 22C10, which labels peripheral neurons. (D) Abdominal hemisegments labeled with both anti-PPK antibody (green) and 22C10 (orange). Neurons expressing PPK are stained by both antibodies and are yellow (arrows). (E and F) High magnification of dorsal cluster of abdominal peripheral neurons double labeled with 22C10 and anti-PPK antibody. Panels show 22C10 staining (E, red), anti-PPK staining (neuron dmd6; F, green), and colocalization (G, yellow). (H and I) High magnification views of PPK+ neurons labeled with anti-PPK antibody showing dendritic arborization and varicosities (I, arrow). (J) Schematic diagram of abdominal PNS neurons. PPK is expressed in one neuron (green) in each cluster of neurons. Diagram and nomenclature are according to Brewster and Bodmer (5).
Figure 4
Coexpression of PPK and BNC1. (A) Oocytes expressed BNC1G430V plus either SEAP, CFTR, or PPK. Current inhibited by a maximal dose of amiloride (100 μM) at −100 mV was measured. Amiloride-sensitive currents (Iamiloride) were normalized to average current from the SEAP control group on that day. For each group, n ⩾ 10 oocytes. Error bars represent SEM; asterisk indicates a significant difference from control current (P < 0.0001). In oocytes expressing BNC1G430V and SEAP, Iamiloride averaged 1912 ± 159 nA. (B) Coimmunoprecipitation of PPK with BNC1. COS-7 cells were transfected with cDNAs encoding BNC1FLAG and/or PPKmyc. Cell lysates were immunoprecipitated with anti-FLAG antibody. Precipitating protein was separated on a 10% polyacrylamide gel and detected by Western blot using the anti-myc antibody.
Figure 5
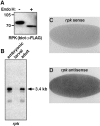
Expression, Northern blot analysis, and in situ hybridization of RPK. (A) RPK is a glycoprotein. COS-7 cells were transfected with cDNA encoding RPK. Cell lysates were incubated overnight with or without endoglycosidase H, as indicated. Proteins were separated on 8% polyacrylamide gels, and detected by Western blot using anti-FLAG antibody. (B) Northern blot analysis of Drosophila embryonic, larval and adult poly(A)+ RNA using an rpk probe. Exposure time was 12 h. The same blot was used for both ppk (Fig. 2_C_) and rpk hybridizations. The presence of ppk message in larval RNA (Fig. 2_C_) served as a positive control. The intensity of the rpk signal suggests that in embryos and adults rpk transcripts may be more abundant than ppk transcripts. (C and D) 0–3 h Drosophila embryos labeled with either a sense (C) or antisense (D) rpk riboprobe. rpk transcripts appear dark.
Figure 6
Na+ channel currents in oocytes expressing RPK. (A) Current tracing from an oocyte expressing RPK. Oocyte was bathed in Na+ Ringers solution. Membrane voltage was clamped at −80 mV. Amiloride (100 μM) was present in the bath during time indicated by the solid bar. Time and current scales are shown. (B) Current–voltage relationships of amiloride-sensitive current from representative oocyte expressing either RPK or SEAP (control). Oocytes were bathed in Na+ or K+ Ringers, as indicated.
Figure 7
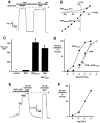
Activation of RPK by the Deg mutation. (A) Current tracing from an oocyte expressing RPKA524V. Oocyte was bathed in Na+ or K+ Ringers solution, as indicated by top bars. Membrane voltage was clamped at −80 mV. Amiloride (100 μM) was present in the bath during time indicated by solid bars. Time and current scales are shown; dashed line indicates zero current. (B) Current–voltage relationships of amiloride-sensitive current in oocytes expressing RPKA524V and bathed in Na+ or K+ Ringers, as indicated. (C) Amount of amiloride-sensitive current in oocytes expressing either RPK, RPKA524V, or a 1:1 ratio of RPK and RPKA524V. Control oocytes were injected with SEAP. Current inhibited by a maximal dose of amiloride (1 mM) at −60 mV was measured. Data are average ± SEM from at least eight oocytes. Asterisks indicate a significant difference from RPK current (P < 0.01). Currents in oocytes expressing RPKA524V or both RPK and RPKA524V were not significantly different (_P_ > 0.1). (D) Dose–response curves showing effect of amiloride on oocytes expressing RPK, RPKA524V, or a 1:1 ratio of RPK and RPKA524V at −60 mV. Data are average ± SEM from at least 8 oocytes; error bars are hidden by symbols. (E) Current tracing from an oocyte expressing RPKA524V. Oocyte was bathed in Na+ Ringers solution and membrane voltage was clamped to −60 mV. During time indicated by the hatched bar, Gd3+ (at concentrations ranging from 1 μM to 1 mM) was present in bath solution. Solid bars indicate 10 μM amiloride. (F) Dose–response curve showing effect of Gd3+ on oocytes expressing RPKA524V at −60 mV. Data are average ± SEM from eight oocytes; error bars are hidden by symbols.
Similar articles
- The genetic architecture of degenerin/epithelial sodium channels in Drosophila.
Zelle KM, Lu B, Pyfrom SC, Ben-Shahar Y. Zelle KM, et al. G3 (Bethesda). 2013 Mar;3(3):441-50. doi: 10.1534/g3.112.005272. Epub 2013 Mar 1. G3 (Bethesda). 2013. PMID: 23449991 Free PMC article. - dGNaC1, a gonad-specific amiloride-sensitive Na+ channel.
Darboux I, Lingueglia E, Champigny G, Coscoy S, Barbry P, Lazdunski M. Darboux I, et al. J Biol Chem. 1998 Apr 17;273(16):9424-9. doi: 10.1074/jbc.273.16.9424. J Biol Chem. 1998. PMID: 9545267 - Drosophila DEG/ENaC pickpocket genes are expressed in the tracheal system, where they may be involved in liquid clearance.
Liu L, Johnson WA, Welsh MJ. Liu L, et al. Proc Natl Acad Sci U S A. 2003 Feb 18;100(4):2128-33. doi: 10.1073/pnas.252785099. Epub 2003 Feb 5. Proc Natl Acad Sci U S A. 2003. PMID: 12571352 Free PMC article. - DEG/ENaC channels: a touchy superfamily that watches its salt.
Mano I, Driscoll M. Mano I, et al. Bioessays. 1999 Jul;21(7):568-78. doi: 10.1002/(SICI)1521-1878(199907)21:7<568::AID-BIES5>3.0.CO;2-L. Bioessays. 1999. PMID: 10472184 Review. - ENaC subunits are molecular components of the arterial baroreceptor complex.
Drummond HA, Welsh MJ, Abboud FM. Drummond HA, et al. Ann N Y Acad Sci. 2001 Jun;940:42-7. doi: 10.1111/j.1749-6632.2001.tb03665.x. Ann N Y Acad Sci. 2001. PMID: 11458698 Review.
Cited by
- Drosophila ppk19 encodes a proton-gated and mechanosensitive ion channel.
Jang W, Lim JY, Kang S, Kim M, Hwang SW, Kim C. Jang W, et al. Sci Rep. 2022 Nov 1;12(1):18346. doi: 10.1038/s41598-022-23236-3. Sci Rep. 2022. PMID: 36319833 Free PMC article. - Dendritic filopodia, Ripped Pocket, NOMPC, and NMDARs contribute to the sense of touch in Drosophila larvae.
Tsubouchi A, Caldwell JC, Tracey WD. Tsubouchi A, et al. Curr Biol. 2012 Nov 20;22(22):2124-34. doi: 10.1016/j.cub.2012.09.019. Epub 2012 Oct 25. Curr Biol. 2012. PMID: 23103192 Free PMC article. - The genetic architecture of degenerin/epithelial sodium channels in Drosophila.
Zelle KM, Lu B, Pyfrom SC, Ben-Shahar Y. Zelle KM, et al. G3 (Bethesda). 2013 Mar;3(3):441-50. doi: 10.1534/g3.112.005272. Epub 2013 Mar 1. G3 (Bethesda). 2013. PMID: 23449991 Free PMC article. - How we feel: ion channel partnerships that detect mechanical inputs and give rise to touch and pain perception.
Geffeney SL, Goodman MB. Geffeney SL, et al. Neuron. 2012 May 24;74(4):609-19. doi: 10.1016/j.neuron.2012.04.023. Neuron. 2012. PMID: 22632719 Free PMC article. Review. - Insights into the genomic evolution of insects from cricket genomes.
Ylla G, Nakamura T, Itoh T, Kajitani R, Toyoda A, Tomonari S, Bando T, Ishimaru Y, Watanabe T, Fuketa M, Matsuoka Y, Barnett AA, Noji S, Mito T, Extavour CG. Ylla G, et al. Commun Biol. 2021 Jun 14;4(1):733. doi: 10.1038/s42003-021-02197-9. Commun Biol. 2021. PMID: 34127782 Free PMC article.
References
- Akoev, G.N., B.V. Krylov, and N.P. Alekseev. 1988. Mechanoreceptors: Their Functional Organization. Springer-Verlag, Berlin. 1–189.
- Bodmer R, Jan YN. Morphological differentiation of the embryonic peripheral neurons in Drosophila. . Roux's Arch Dev Biol. 1987;196:69–77. - PubMed
- Bodmer R, Carretto R, Jan Y-N. Neurogenesis of the peripheral nervous system in Drosophilaembryos: DNA replication patterns and cell lineages. Neuron. 1989;3:21–32. - PubMed
- Brewster R, Bodmer R. Origin and specification of type II sensory neurons in Drosophilia. . Development. 1995;121:2923–2936. - PubMed
- Canessa CM, Horisberger J-D, Rossier BC. Epithelial sodium channel related to proteins involved in neurodegeneration. Nature. 1993;361:467–470. - PubMed
Publication types
MeSH terms
Substances
LinkOut - more resources
Full Text Sources
Molecular Biology Databases
Miscellaneous


