Kinetic analysis of the specific host response to a murine gammaherpesvirus - PubMed (original) (raw)
Kinetic analysis of the specific host response to a murine gammaherpesvirus
P G Stevenson et al. J Virol. 1998 Feb.
Abstract
Respiratory infection of BALB/c mice with the murine gammaherpesvirus 68 (MHV-68) induces the clonal expansion of virus-specific cytotoxic T-lymphocyte (CTL) precursors (CTLp) in the regional, mediastinal lymph nodes (MLN). Some of these CTLps differentiate to become fully functional CTL effectors, which can be detected in both the lymphoid tissue and in the site of pathology in the lung. Though the lymph nodes and spleen harbor substantial populations of latently infected B cells for life, the level of virus-specific CTL activity decreases rapidly in all sites. The CD8+ CTLp numbers fall to background levels in the MLN within several months of the termination of the productive phase of MHV-68 infection in the respiratory epithelium but are maintained at relatively low frequency in the spleen. The continued presence of a gamma interferon-producing, MHV-68-specific CD4+ set can also be demonstrated in cultured spleen cells. The virus-specific immunoglobulin G (IgG) response is slow to develop, with serum neutralizing antibody and enzyme-linked immunosorbent assay titers continuing to rise for several months. The level of total serum IgG increases dramatically within 2 weeks of infection, probably as a consequence of polyclonal B-cell activation, and remains high. The immune response profile is clearly influenced by the persistence of this DNA virus.
Figures
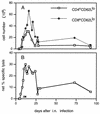
FIG. 1
Recovery of antiviral CTL from the lung by BAL. Cells were pooled from pairs of mice and adhered to plastic for 1 h at 37°C before assay to remove macrophages. The proportion of activated T cells in each pool was determined by flow cytometric analysis (A). CD8+ CD62 Llo cells typically made up 40% of the total at the peak of the response. Virus-specific cytotoxicity for an E:T ratio of 30:1 (based on the total cells harvested) is shown in panel B. Net specific lysis = % specific lysis of MHV-68-infected targets − % specific lysis of uninfected targets (which did not exceed 5%). Results were pooled from four separate experiments. Each point shows the mean of one to three determinations. ∗, MHV-68-specific cytotoxicity by BAL cells from influenza A/HKx31 virus-infected BALB/c mice. ▵, cytotoxicity for MHV-68-infected BALB/c-3T3 cells mediated by BAL cells from MHV-68-infected C57BL/6 (H-2b) mice.
FIG. 2
Flow cytometric analysis of lymphocyte phenotypes before restimulation. Cells were pooled from two to three mice for each time point, and the mean numbers of each cell type per mouse were derived from the total cell counts and the proportions stained specifically by flow cytometry. The results were pooled from four separate experiments, with each point showing the mean of one to three determinations.
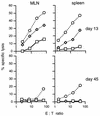
FIG. 3
Cytotoxic activity of lymphocyte population without prior restimulation. Cells were pooled from three mice per time point and enriched for CD8+ T cells by in vitro depletion with rat anti-mouse I-Ed and rat anti-mouse CD4 MAbs, followed by sheep anti-rat- and sheep anti-mouse-coated magnetic beads (Dynal). The enriched populations contained 70 to 90% CD8+ T cells and <1% CD4+ T cells. The E:T ratios are corrected for to the number of CD8+ T cells in the effector cell populations. □, untreated BALB/c-3T3 cells; ◊, MHV-68-infected BALB/c-3T3 cells; ○, p815 cells plus anti-CD3 MAb.
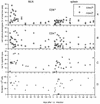
FIG. 4
Functional analysis of MHV-68-specific T cells after restimulation in bulk culture. Cells were pooled from two to three mice and restimulated in vitro for 5 days with MHV-68-infected irradiated feeder cells (see Materials and Methods). (A and B) Percentages of activated (CD62Llo) and naive (CD62Lhi) T cells after 5 days of culture. The remainder of the cultured cells were almost all B220+ B lymphocytes. (C) Net percent specific lysis (% specific lysis of MHV-68-infected targets − % specific lysis of uninfected targets [which did not exceed 15%]) for an E:T ratio of 30:1 (lymph node cells) or 60:1 (spleen cells). E:T ratios refer to the total number of live cells harvested from day 5 cultures. ⊕, killing of MHV-68-infected H-2-mismatched NIH 3T3 cells. (D) IFN-γ production by cells from the same restimulated populations. This assay detects only responding CD4+ T cells. ◊, CD8-depleted spleen cells; ○, CD4-depleted spleen cells; ⊠, restimulated naive spleen cells. Results were pooled from four separate experiments, and each point shows the mean of one to three determinations.
FIG. 5
CD8 dependence of virus-specific cytotoxicity. Spleen cells from mice immunized i.n. 2 weeks earlier with MHV-68 were restimulated in vitro for 5 days. T-cell subsets were then depleted as indicated, using rat anti-mouse CD4 or rat anti-mouse CD8 MAb followed by sheep anti-rat-coated magnetic beads. The levels of virus-specific and redirected cytotoxicity were then determined as described in Materials and Methods. □, uninfected BALB/c-3T3 cells; ◊, MHV-68-infected BALB/c-3T3 cells; ○, untreated p815 cells; ▵, p815 cells plus anti-CD3 MAb.
FIG. 6
Regression analysis of virus-specific CTLp frequencies. The plots are typical of the LDA plots used to calculate the data in Table 1. The mean number of CD8+ T cells in the responder cell populations was calculated from the total cell numbers and from flow cytometric staining.
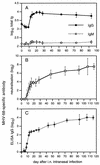
FIG. 7
Kinetics of the virus-specific and total serum Ig response in mice infected with MHV-68. Each point shows the mean and standard deviation of results from three to six individual mouse sera pooled from four experiments. The neutralizing antibody titer (B) was determined by plaque inhibition (see Materials and Methods), whereas other antibody titers (A and C) were determined by ELISA. All measurements were made relative to a standard pool of immune sera and are expressed in arbitrary units.
Similar articles
- Murine gammaherpesvirus-induced splenomegaly: a critical role for CD4 T cells.
Usherwood EJ, Ross AJ, Allen DJ, Nash AA. Usherwood EJ, et al. J Gen Virol. 1996 Apr;77 ( Pt 4):627-30. doi: 10.1099/0022-1317-77-4-627. J Gen Virol. 1996. PMID: 8627250 - Gamma interferon is not essential for recovery from acute infection with murine gammaherpesvirus 68.
Sarawar SR, Cardin RD, Brooks JW, Mehrpooya M, Hamilton-Easton AM, Mo XY, Doherty PC. Sarawar SR, et al. J Virol. 1997 May;71(5):3916-21. doi: 10.1128/JVI.71.5.3916-3921.1997. J Virol. 1997. PMID: 9094668 Free PMC article. - Absence of a functional defect in CD8+ T cells during primary murine gammaherpesvirus-68 infection of I-A(b-/-) mice.
Belz GT, Liu H, Andreansky S, Doherty PC, Stevenson PG. Belz GT, et al. J Gen Virol. 2003 Feb;84(Pt 2):337-341. doi: 10.1099/vir.0.18821-0. J Gen Virol. 2003. PMID: 12560565 - Dissecting the host response to a gamma-herpesvirus.
Doherty PC, Christensen JP, Belz GT, Stevenson PG, Sangster MY. Doherty PC, et al. Philos Trans R Soc Lond B Biol Sci. 2001 Apr 29;356(1408):581-93. doi: 10.1098/rstb.2000.0786. Philos Trans R Soc Lond B Biol Sci. 2001. PMID: 11313013 Free PMC article. Review. - Natural history of murine gamma-herpesvirus infection.
Nash AA, Dutia BM, Stewart JP, Davison AJ. Nash AA, et al. Philos Trans R Soc Lond B Biol Sci. 2001 Apr 29;356(1408):569-79. doi: 10.1098/rstb.2000.0779. Philos Trans R Soc Lond B Biol Sci. 2001. PMID: 11313012 Free PMC article. Review.
Cited by
- Conserved Gammaherpesvirus Protein Kinase Counters the Antiviral Effects of Myeloid Cell-Specific STAT1 Expression To Promote the Establishment of Splenic B Cell Latency.
Sylvester PA, Jondle CN, Stoltz KP, Lanham J, Dittel BN, Tarakanova VL. Sylvester PA, et al. J Virol. 2021 Aug 10;95(17):e0085921. doi: 10.1128/JVI.00859-21. Epub 2021 Aug 10. J Virol. 2021. PMID: 34132573 Free PMC article. - A mouse model for infectious mononucleosis.
Flaño E, Woodland DL, Blackman MA. Flaño E, et al. Immunol Res. 2002;25(3):201-17. doi: 10.1385/IR:25:3:201. Immunol Res. 2002. PMID: 12018460 Review. - Rta of murine gammaherpesvirus 68 reactivates the complete lytic cycle from latency.
Wu TT, Usherwood EJ, Stewart JP, Nash AA, Sun R. Wu TT, et al. J Virol. 2000 Apr;74(8):3659-67. doi: 10.1128/jvi.74.8.3659-3667.2000. J Virol. 2000. PMID: 10729142 Free PMC article. - In vivo imaging of murid herpesvirus-4 infection.
Milho R, Smith CM, Marques S, Alenquer M, May JS, Gillet L, Gaspar M, Efstathiou S, Simas JP, Stevenson PG. Milho R, et al. J Gen Virol. 2009 Jan;90(Pt 1):21-32. doi: 10.1099/vir.0.006569-0. J Gen Virol. 2009. PMID: 19088269 Free PMC article. - γ-herpesvirus latency attenuates Mycobacterium tuberculosis infection in mice.
Miller HE, Johnson KE, Tarakanova VL, Robinson RT. Miller HE, et al. Tuberculosis (Edinb). 2019 May;116:56-60. doi: 10.1016/j.tube.2019.04.022. Epub 2019 Apr 30. Tuberculosis (Edinb). 2019. PMID: 31153519 Free PMC article.
References
- Akira S, Yoshida K, Tanaka T, Taga T, Kishimoto T. Targeted disruption of the IL-6 related genes: gp130 and NF-IL-6. Immunol Rev. 1995;148:221–253. - PubMed
- Allan W, Tabi Z, Cleary A, Doherty P C. Cellular events in the lymph node and lung of mice with influenza. Consequences of depleting CD4+ T cells. J Immunol. 1990;144:3980–3986. - PubMed
- Borysiewicz L K, Sissons J G. Cytotoxic T cells and human herpes virus infections. Curr Top Microbiol Immunol. 1994;189:123–150. - PubMed
- Bowden R J, Simas J P, Davis A J, Efstathiou S. Murine γ-herpesvirus 68 encodes tRNA-like sequences which are expressed during latency. J Gen Virol. 1997;78:1675–1687. - PubMed
Publication types
MeSH terms
LinkOut - more resources
Full Text Sources
Molecular Biology Databases
Research Materials


