Measurement of the effects of acetic acid and extracellular pH on intracellular pH of nonfermenting, individual Saccharomyces cerevisiae cells by fluorescence microscopy - PubMed (original) (raw)
Measurement of the effects of acetic acid and extracellular pH on intracellular pH of nonfermenting, individual Saccharomyces cerevisiae cells by fluorescence microscopy
L U Guldfeldt et al. Appl Environ Microbiol. 1998 Feb.
Abstract
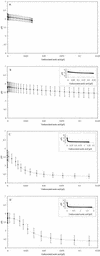
The effects of acetic acid and extracellular pH (pHex) on the intracellular pH (pHi) of nonfermenting, individual Saccharomyces cerevisiae cells were studied by using a new experimental setup comprising a fluorescence microscope and a perfusion system. S. cerevisiae cells grown in brewer's wort to the stationary phase were stained with fluorescein diacetate and transferred to a perfusion chamber. The extracellular concentration of undissociated acetic acid at various pHex values was controlled by perfusion with 2 g of total acetic acid per liter at pHex 3.5, 4.5, 5.6, and 6.5 through the chamber by using a high-precision pump. The pHi of individual S. cerevisiae cells during perfusion was measured by fluorescence microscopy and ratio imaging. Potential artifacts, such as fading and efflux of fluorescein, could be neglected within the experimental time used. At pHex 6.5, the pHi of individual S. cerevisiae cells decreased as the extracellular concentration of undissociated acetic acid increased from 0 to 0.035 g/liter, whereas at pHex 3.5, 4.5, and 5.6, the pHi of individual S. cerevisiae cells decreased as the extracellular concentration of undissociated acetic acid increased from 0 to 0.10 g/liter. At concentrations of undissociated acetic acid of more than 0.10 g/liter, the pHi remained constant. The decreases in pHi were dependent on the pHex; i.e., the decreases in pHi at pHex 5.6 and 6.5 were significantly smaller than the decreases in pHi at pHex 3.5 and 4.5.
Figures
FIG. 1
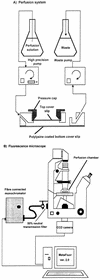
Schematic diagrams showing the perfusion system (A) and the fluorescence microscope (B). CCD, charge-coupled device.
FIG. 2
Relationship between the logarithm of the 490 nm/435 nm ratio and pH. The in vitro calibration curve was prepared by using 10 μM fluorescein in PBS adjusted to various pH values as described in Materials and Methods.
FIG. 3
Characterization of the flow of perfusion solution through the perfusion chamber. The chamber was filled with PBS (pH 5.6). At time zero, perfusion with 5 μM fluorescein in PBS (pH 5.6) at a rate of 0.6 μl/s was initiated. Fluorescence intensity after excitation at 435 nm for 1,000 ms was measured as described in Materials and Methods.
FIG. 4
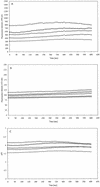
Fluorescence intensity after excitation at 490 nm (A) and 435 nm (B), and pHi (C) of five representative S. cerevisiae cells during perfusion with PBS (pHex 4.5) at a rate of 0.6 μl/s. Fluorescent staining of cells and ratio imaging were performed as described in Materials and Methods.
FIG. 5
Relationship between pHi of individual S. cerevisiae cells and extracellular concentration of undissociated acetic acid. The cells were perfused with 2 g of total acetic acid per liter in PBS at pHex 6.5 (A), pHex 5.6 (B), pHex 4.5 (C) and pHex 3.5 (D) at a rate of 0.6 μl/s. The pHi values presented are averages from 20 to 30 randomly selected cells. The calculated standard deviations are shown by error bars. The insets show the relationship between pHi and the full range of extracellular concentrations of undissociated acetic acid used in the experiments. The time intervals between data points are 20 s (A) (for clarity) and 10 s (B through D). Fluorescent staining of cells, ratio imaging, and calculation of the undissociated acetic acid concentrations during perfusion were performed as described in Materials and Methods.
Similar articles
- Individual cells of Saccharomyces cerevisiae and Zygosaccharomyces bailii exhibit different short-term intracellular pH responses to acetic acid.
Arneborg N, Jespersen L, Jakobsen M. Arneborg N, et al. Arch Microbiol. 2000 Jul-Aug;174(1-2):125-8. doi: 10.1007/s002030000185. Arch Microbiol. 2000. PMID: 10985752 - Lactic acid tolerance determined by measurement of intracellular pH of single cells of Candida krusei and Saccharomyces cerevisiae isolated from fermented maize dough.
Halm M, Hornbaek T, Arneborg N, Sefa-Dedeh S, Jespersen L. Halm M, et al. Int J Food Microbiol. 2004 Jul 1;94(1):97-103. doi: 10.1016/j.ijfoodmicro.2003.12.019. Int J Food Microbiol. 2004. PMID: 15172490 - Influence of medium buffering capacity on inhibition of Saccharomyces cerevisiae growth by acetic and lactic acids.
Thomas KC, Hynes SH, Ingledew WM. Thomas KC, et al. Appl Environ Microbiol. 2002 Apr;68(4):1616-23. doi: 10.1128/AEM.68.4.1616-1623.2002. Appl Environ Microbiol. 2002. PMID: 11916676 Free PMC article. - Omics analysis of acetic acid tolerance in Saccharomyces cerevisiae.
Geng P, Zhang L, Shi GY. Geng P, et al. World J Microbiol Biotechnol. 2017 May;33(5):94. doi: 10.1007/s11274-017-2259-9. Epub 2017 Apr 12. World J Microbiol Biotechnol. 2017. PMID: 28405910 Review. - Carboxylic Acids Plasma Membrane Transporters in Saccharomyces cerevisiae.
Casal M, Queirós O, Talaia G, Ribas D, Paiva S. Casal M, et al. Adv Exp Med Biol. 2016;892:229-251. doi: 10.1007/978-3-319-25304-6_9. Adv Exp Med Biol. 2016. PMID: 26721276 Review.
Cited by
- Polygenic analysis of very high acetic acid tolerance in the yeast Saccharomyces cerevisiae reveals a complex genetic background and several new causative alleles.
Stojiljkovic M, Foulquié-Moreno MR, Thevelein JM. Stojiljkovic M, et al. Biotechnol Biofuels. 2020 Jul 16;13:126. doi: 10.1186/s13068-020-01761-5. eCollection 2020. Biotechnol Biofuels. 2020. PMID: 32695222 Free PMC article. - Use of alcohol vinegar in the inhibition of Candida spp. and its effect on the physical properties of acrylic resins.
de Castro RD, Mota AC, de Oliveira Lima E, Batista AU, de Araújo Oliveira J, Cavalcanti AL. de Castro RD, et al. BMC Oral Health. 2015 Apr 28;15:52. doi: 10.1186/s12903-015-0035-5. BMC Oral Health. 2015. PMID: 25928798 Free PMC article. - 2,2-Diphenyl-1-picrylhydrazyl as a screening tool for recombinant monoterpene biosynthesis.
Behrendorff JB, Vickers CE, Chrysanthopoulos P, Nielsen LK. Behrendorff JB, et al. Microb Cell Fact. 2013 Aug 23;12:76. doi: 10.1186/1475-2859-12-76. Microb Cell Fact. 2013. PMID: 23968454 Free PMC article. - The Role of Fatty Acid Metabolites in Vaginal Health and Disease: Application to Candidiasis.
Baldewijns S, Sillen M, Palmans I, Vandecruys P, Van Dijck P, Demuyser L. Baldewijns S, et al. Front Microbiol. 2021 Jul 2;12:705779. doi: 10.3389/fmicb.2021.705779. eCollection 2021. Front Microbiol. 2021. PMID: 34276639 Free PMC article. Review. - Functional and structural insights into activation of TRPV2 by weak acids.
Haug FM, Pumroy RA, Sridhar A, Pantke S, Dimek F, Fricke TC, Hage A, Herzog C, Echtermeyer FG, de la Roche J, Koh A, Kotecha A, Howard RJ, Lindahl E, Moiseenkova-Bell V, Leffler A. Haug FM, et al. EMBO J. 2024 Jun;43(11):2264-2290. doi: 10.1038/s44318-024-00106-4. Epub 2024 Apr 26. EMBO J. 2024. PMID: 38671253 Free PMC article.
References
- Arneborg N, Moos M, Jakobsen M. The effect of acetic acid and specific growth rate on acetic acid tolerance and trehalose content of Saccharomyces cerevisiae. Biotechnol Lett. 1995;17:1299–1304.
- Breeuwer P, Drocourt J-L, Bunschoten N, Zwietering M H, Rombouts F M, Abee T. Characterization of uptake and hydrolysis of fluorescein diacetate and carboxyfluorescein diacetate by intracellular esterases in Saccharomyces cerevisiae, which result in accumulation of fluorescent product. Appl Environ Microbiol. 1995;61:1614–1619. - PMC - PubMed
- Casal M, Cardoso H, Leão C. Mechanisms regulating the transport of acetic acid in Saccharomyces cerevisiae. Microbiology. 1996;142:1385–1390. - PubMed
Publication types
MeSH terms
Substances
LinkOut - more resources
Full Text Sources
Molecular Biology Databases


