Caveolin-1 and -2 in the exocytic pathway of MDCK cells - PubMed (original) (raw)
Caveolin-1 and -2 in the exocytic pathway of MDCK cells
P Scheiffele et al. J Cell Biol. 1998.
Abstract
We have studied the biosynthesis and transport of the endogenous caveolins in MDCK cells. We show that in addition to homooligomers of caveolin-1, heterooligomeric complexes of caveolin-1 and -2 are formed in the ER. The oligomers become larger, increasingly detergent insoluble, and phosphorylated on caveolin-2 during transport to the cell surface. In the TGN caveolin-1/-2 heterooligomers are sorted into basolateral vesicles, whereas larger caveolin-1 homooligomers are targeted to the apical side. Caveolin-1 is present on both the apical and basolateral plasma membrane, whereas caveolin-2 is enriched on the basolateral surface where caveolae are present. This suggests that caveolin-1 and -2 heterooligomers are involved in caveolar biogenesis in the basolateral plasma membrane. Anti-caveolin-1 antibodies inhibit the apical delivery of influenza virus hemagglutinin without affecting basolateral transport of vesicular stomatitis virus G protein. Thus, we suggest that caveolin-1 homooligomers play a role in apical transport.
Figures
Figure 1
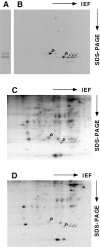
Caveolin-1 and -2 in MDCK cells. Anti–caveolin-1 immunoprecipitates were analyzed by 13% SDS-PAGE (A) and by 2D gel electrophoresis (B). For comparison, 2D gels of immunoisolated basolateral (C) and apical (D) vesicles are shown. α– and β–caveolin-1 are marked by arrowheads. Caveolin-2 is marked by arrows. Filter-grown MDCK cells metabolically labeled with [35S]methionine were lysed and then caveolin was immunoprecipitated using anti– caveolin-1 amino-terminal antibodies. The samples were boiled in alkaline sample buffer before electrophoresis.
Figure 2
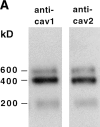
Specificity of the anti–caveolin-2 antibody. A MDCK cell lysate separated by SDS-PAGE (A and B) or by 2D gel electrophoresis C was analyzed by Western blotting. Blots were probed with anti–caveolin-1 amino-terminal antibodies (A) or with anti–caveolin-2 antibodies (B and C). The two spots identified in C correspond to two clusters of spots detected in the 2D gel of [35S]methionine and immunoprecipitated samples (refer to Fig. 1). The larger cluster has the same molecular weight as the spot cut for microsequencing. The 5′ cDNA sequence of canine caveolin-2 and the encoded amino acids are aligned with the human expressed sequence tag containing the upstream ATG codon (D). The sequence of a tryptic peptide is underlined. The peptide used to raise anti–caveolin-2 specific antibodies is indicated by a box.
Figure 3
Caveolin-2 forms high molecular weight complexes. Western blotting using anti–caveolin-1 antibody N-20 or anti– caveolin-2 antibodies was performed after separating MDCK cell lysate on SDS-PAGE without boiling (A). Alternatively, the cell lysate was first fractionated by sedimentation velocity in a 5–30% sucrose gradient, and TCA proteins precipitated from the fractions were separated by 13% SDS-PAGE after boiling in alkaline sample buffer (B). The migration of molecular mass standards in the gradient is indicated.
Figure 4
Composition of the caveolin oligomeric complex at steady state. MDCK cells were labeled overnight with [35S]methionine, proteins were immunoprecipitated with caveolin-1 (top) or -2 antibodies (bottom), and then analyzed by 1- (left) or 2D gel electrophoresis (right) after boiling in alkaline sample buffer. The anode is to the right. For quantification of the relative amounts of caveolin-1 and -2, gels were scanned by a Phosphor Imager.
Figure 5
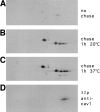
Analysis of the caveolin complex by 2D gel electrophoresis during biosynthetic transport. MDCK cells were pulse labeled with [35S]methionine for 7 min and either lysed immediately (A), chased for 1 h at 20°C (B) or chased for 1 h at 37°C (C) before lysis. Alternatively, cells were labeled for 3 h with [32P]ATP (D). The caveolin complex was immunoprecipitated by anti–caveolin-1 antibodies and then analyzed on 2D gels.
Figure 6
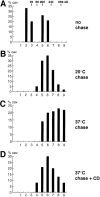
Size of the caveolin oligomeric complexes during biosynthetic transport and after cyclodextrin treatment. Filter-grown MDCK cells were pulse labeled for 7 min with [35S]methionine and then chased as indicated in A, B, and C. When cyclodextrin was added (+ CD), MDCK cells, pulsed for 7 min with [35S]methionine and chased for 1 h at 37°C, were treated for an additional 1 h at 37°C in the presence of 10 mM methyl-β-cyclodextrin as detailed in Materials and Methods. The lysates were fractionated by sedimentation velocity gradient centrifugation in 5–30% sucrose and caveolin immunoprecipitated from the fractions using anti– caveolin-1 amino-terminal antibodies. The intensities of the bands resolved by SDS-PAGE (containing caveolin-1 and -2) were scanned by a Phosphor Imager. The percentage of caveolin in each fraction is presented as bars.
Figure 7
Detergent solubility of the caveolin complexes during biosynthetic transport. MDCK cells were pulsed for 7 min with [35S]methionine and then chased. Cells were lysed in 20 mM CHAPS in TNE and the caveolin complex was immunoprecipitated from the supernatant (S) and the pellet (P) and then analyzed by 3–17% SDS-PAGE after boiling. Note that the complex is precipitated increasingly efficiently during the chase. The autoradiograph had to be exposed longer to detect pulse-labeled caveolin in the ER (no chase, data not shown).
Figure 8
Size of the caveolin complexes in immunoisolated apical and basolateral transport vesicles. Apical and basolateral vesicles were isolated from virally infected MDCK cells as described in Materials and Methods. The immunoisolated vesicle preparations were fractionated by sedimentation velocity centrifugation and the caveolin complex in each fraction immunoprecipitated using anti–caveolin-1 antibodies. The radioactivity recovered from each fraction is indicated.
Figure 9
Electron micrographs of TGN-derived vesicles labeled for influenza virus HA (15-nm gold; A) or VSV-G (15-nm gold; B and C) and caveolin-1 (10-nm gold) and caveolin-2 (5-nm gold). The scale bar in C represents 100 nm.
Figure 10
Confocal immunofluorescence microscopy of caveolin-1 and -2 in filter-grown MDCK cells. The cells were labeled with anti–caveolin-1 (A) or -2 antibodies (B and C). Using the confocal microscope, z-sections were taken to show basolateral and apical staining. They were chosen such that the intracellular staining was hardly visualized. C shows an x, y-section taken from the region located above the nucleus (B). Bar, 5 μm.
Figure 11
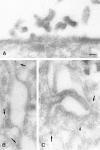
Electron micrographs showing the distribution of caveolin-1 (A and B) and -2 (C) in polarized MDCK cells. In B and C two opposing lateral membranes are shown. Caveolin-1 is present at the apical membrane (A) and at the basolateral membrane (B), where it is mainly present in caveolae (arrows). Caveolin-2 is mainly at the basolateral plasma membrane and its caveolar invaginations (C). A little further from the plasma membrane, caveolin-2 is associated with a vesicular profile (arrowhead), which resembles a caveolar profile deeper in the cell (C). Bar, 100 nm.
Figure 12
Effect of anti– caveolin-1 antibodies on ER-to-Golgi (E–G), basolateral (BL), and apical (AP) transport. Anti–caveolin-1 antibody N-20 (10 μg/ml) was added to SLO-permeabilized MDCK cells, and then the transport of HA from the ER-to-Golgi complex or from the TGN to the apical surface or the transport of VSV-G from the TGN to the basolateral surface was measured. Transport is expressed as percentage of cytosol-dependent transport obtained in the absence of added antibody.
Similar articles
- Induction of caveolae in the apical plasma membrane of Madin-Darby canine kidney cells.
Verkade P, Harder T, Lafont F, Simons K. Verkade P, et al. J Cell Biol. 2000 Feb 21;148(4):727-39. doi: 10.1083/jcb.148.4.727. J Cell Biol. 2000. PMID: 10684254 Free PMC article. - VIP36, a novel component of glycolipid rafts and exocytic carrier vesicles in epithelial cells.
Fiedler K, Parton RG, Kellner R, Etzold T, Simons K. Fiedler K, et al. EMBO J. 1994 Apr 1;13(7):1729-40. doi: 10.1002/j.1460-2075.1994.tb06437.x. EMBO J. 1994. PMID: 8157011 Free PMC article. - [Identification of signals and mechanisms of sorting of plasma membrane proteins in intestinal epithelial cells].
Breuza L, Monlauzeur L, Arsanto JP, Le Bivic A. Breuza L, et al. J Soc Biol. 1999;193(2):131-4. J Soc Biol. 1999. PMID: 10451345 French. - VIP21-Caveolin, a protein of the trans-Golgi network and caveolae.
Kurzchalia TV, Dupree P, Monier S. Kurzchalia TV, et al. FEBS Lett. 1994 Jun 6;346(1):88-91. doi: 10.1016/0014-5793(94)00466-8. FEBS Lett. 1994. PMID: 8206165 Review. - Caveolae and caveolins.
Parton RG. Parton RG. Curr Opin Cell Biol. 1996 Aug;8(4):542-8. doi: 10.1016/s0955-0674(96)80033-0. Curr Opin Cell Biol. 1996. PMID: 8791446 Review.
Cited by
- Caveolae as plasma membrane sensors, protectors and organizers.
Parton RG, del Pozo MA. Parton RG, et al. Nat Rev Mol Cell Biol. 2013 Feb;14(2):98-112. doi: 10.1038/nrm3512. Nat Rev Mol Cell Biol. 2013. PMID: 23340574 Review. - Involvement of lipid rafts in nephrin phosphorylation and organization of the glomerular slit diaphragm.
Simons M, Schwarz K, Kriz W, Miettinen A, Reiser J, Mundel P, Holthöfer H. Simons M, et al. Am J Pathol. 2001 Sep;159(3):1069-77. doi: 10.1016/S0002-9440(10)61782-8. Am J Pathol. 2001. PMID: 11549599 Free PMC article. - Induction of caveolae in the apical plasma membrane of Madin-Darby canine kidney cells.
Verkade P, Harder T, Lafont F, Simons K. Verkade P, et al. J Cell Biol. 2000 Feb 21;148(4):727-39. doi: 10.1083/jcb.148.4.727. J Cell Biol. 2000. PMID: 10684254 Free PMC article. - Cholesterol depletion reduces apical transport capacity in epithelial Madin-Darby canine kidney cells.
Prydz K, Simons K. Prydz K, et al. Biochem J. 2001 Jul 1;357(Pt 1):11-5. doi: 10.1042/0264-6021:3570011. Biochem J. 2001. PMID: 11415430 Free PMC article. - Caveolin-1α regulates primary cilium length by controlling RhoA GTPase activity.
Rangel L, Bernabé-Rubio M, Fernández-Barrera J, Casares-Arias J, Millán J, Alonso MA, Correas I. Rangel L, et al. Sci Rep. 2019 Feb 4;9(1):1116. doi: 10.1038/s41598-018-38020-5. Sci Rep. 2019. PMID: 30718762 Free PMC article.
References
- Beckers CJM, Keller DS, Balch WE. Semi-intact cells permeable to macromolecules: Use in reconstitution of protein transport from the endoplasmatic reticulum to the Golgi complex. Cell. 1987;50:523–534. - PubMed
- Bravo, R. 1984. Two-dimensional Gel Electrophoresis: A Guide for the Beginner. In Two-dimensional Gel Electrophoresis of Proteins. J.E. Celis and R. Bravo, editors. Academic Press Inc., Orlando, FL. 3–36.
- Dietzen DJ, Hastings WR, Lublin DM. Caveolin is palmitoylated on multiple cystein residues. J Biol Chem. 1995;270:6838–6842. - PubMed
- Fra AM, Williamson E, Simons K, Parton RG. Detergent-insoluble glycolipid microdomains in lymphocytes in the absence of caveolae. J Biol Chem. 1994;269:30745–30748. - PubMed
Publication types
MeSH terms
Substances
LinkOut - more resources
Full Text Sources
Other Literature Sources
Miscellaneous
