Characterization of a human RPD3 ortholog, HDAC3 - PubMed (original) (raw)
Comparative Study
Characterization of a human RPD3 ortholog, HDAC3
S Emiliani et al. Proc Natl Acad Sci U S A. 1998.
Abstract
Histone acetylation levels in cells result from a dynamic equilibrium between competing histone acetylases and deacetylases. Changes in histone acetylation levels occur during both transcriptional activation and silencing. Cloning of the cDNA for a human histone deacetylase (HDAC1) has shown that it represents a human ortholog of the yeast transcriptional regulator RPD3. We have screened the expressed sequence tag database (National Center for Biotechnology Information) with the yeast RPD3 sequence and identified a human ortholog of RPD3, HDAC3. This cDNA encodes a protein of 428 amino acids with 58% sequence identity with HDAC1p. By using a specific polyclonal antiserum recognizing the C-terminal domain of HDAC3p and Western blotting, we detected a single approximately 49-kDa band in several tumor cell lines. HDAC3p is expressed predominantly in the nuclear compartment. Immunoprecipitation experiments with either an antiserum against HDAC3p or an anti-FLAG antiserum and a flagged HDAC3 cDNA showed that HDAc3p exhibits deacetylase activity both on free histones and on purified nucleosomes. This deacetylase activity is inhibited by trichostatin, trapoxin, and butyrate in vitro to the same degree as the deacetylase activity associated to HDAC1p. These observations identify another member of a growing family of human HDAC genes.
Figures
Figure 1
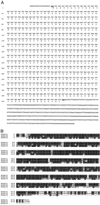
Nucleotide and predicted amino acid sequences of HDAC3. (A) The nucleotide and predicted amino acid sequences of HDAC3 are shown. (B) Protein sequence alignment of HDAC1p, -2p, and -3p. All three proteins were aligned by using
clustal w
(version 1.7) and printed by using
boxshade
(version 3.21). Identical residues are in black; conserved residues are in gray.
Figure 2
HDAC1p and HDAC3p are ubiquitously expressed and predominantly nuclear proteins. (A) Western blot analysis. Western blots containing 20 μg of protein per lane from different cell lines were developed with a polyclonal serum raised against HDAC1p or HDAC3p. Coomassie blue staining of gels showed that similar amounts of cellular protein were loaded in different lanes (data not shown). Sizes of protein markers are indicated. (B) Immunofluorescence. HeLa cells grown on coverslips were fixed, stained with the anti-HDAC1 or anti-HDAC3 antiserum, and examined by immunofluorescence microscopy as described (20). (C) Subcellular localization of HDAC1p and HDAC3p. Jurkat cells nuclear (N) and cytoplasmic (C) fractions were prepared. Proportional amounts of each fraction were analyzed by Western blotting using specific antiserum directed against HDAC3, HDAC1, or IκB-α.
Figure 3
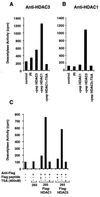
HDAC3 is a HDAC. (A) Cellular extracts from Jurkat cells (5 × 10⁷ cells) were subjected to immunoprecipitation using a polyclonal antiserum against HDAC3p, in the presence of a 100-fold excess of HDAC3 peptide (residues 413–428) or HDAC1 peptide (residues 467–482). As a control, the corresponding preimmune serum was used. Immunoprecipitated complexes were tested for HDAC activity, by measuring the release of [3H]acetate from an acetylated N-terminal H4 peptide (in cpm), in the absence or presence of 400 nM TSA. (B) Same protocol as described for A, except that a polyclonal serum against HDAC1p was used. (C) Cellular extracts (2.5 × 10⁷ cells) from 293 cells stably expressing the HDAC1-FLAG or HDAC3-FLAG fusion protein or control cells were subjected to immunoprecipitation using a monoclonal antibody against the FLAG epitope (10 μg) in the absence or presence of a 100-fold excess of the FLAG peptide. Immunoprecipitated complexes were tested for HDAC activity.
Figure 4
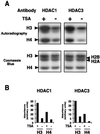
Acetylated nucleosomes are substrate for HDAC1p and HDAC3p. (A) [3H]Acetyllysine-labeled nucleosomes were incubated with anti-HDAC1 (Left) or anti-HDAC3 (Right) immunoprecipitated complexes in the absence or presence of TSA (400 nM). Reaction products were resolved on a 15% SDS/PAGE gel, and histones were visualized by staining with Coomassie blue (Lower) and by autoradiography after enhancement (Upper). The positions of the four histones H2A, H2B, H3, and H4 are indicated. (B) The autoradiogram was quantified after scanning by using the
image
analysis program (National Institutes of Health). Results are expressed as arbitrary absorbance values.
Figure 5
Inhibition of HDAC1p and HDAC3p deacetylase activity by butyrate, TSA, and TPX. Cellular extracts from Jurkat cells were subjected to immunoprecipitation using polyclonal antiserum against HDAC3 or HDAC1, and tested for HDAC activity, in the absence or the presence of increasing concentrations of the following inhibitors: sodium butyrate (0.1, 1, and 10 mM), TSA (0.4, 4, 40, and 400 nM), and TPX (0.4, 4, 40, and 400 nM). Results are expressed as a percentage of the HDAC activity obtained in the absence of inhibitors.
Similar articles
- A role for histone deacetylase activity in HDAC1-mediated transcriptional repression.
Hassig CA, Tong JK, Fleischer TC, Owa T, Grable PG, Ayer DE, Schreiber SL. Hassig CA, et al. Proc Natl Acad Sci U S A. 1998 Mar 31;95(7):3519-24. doi: 10.1073/pnas.95.7.3519. Proc Natl Acad Sci U S A. 1998. PMID: 9520398 Free PMC article. - Functional analysis of the SIN3-histone deacetylase RPD3-RbAp48-histone H4 connection in the Xenopus oocyte.
Vermaak D, Wade PA, Jones PL, Shi YB, Wolffe AP. Vermaak D, et al. Mol Cell Biol. 1999 Sep;19(9):5847-60. doi: 10.1128/MCB.19.9.5847. Mol Cell Biol. 1999. PMID: 10454532 Free PMC article. - Histone deacetylase 1/mSin3A disrupts gamma interferon-induced CIITA function and major histocompatibility complex class II enhanceosome formation.
Zika E, Greer SF, Zhu XS, Ting JP. Zika E, et al. Mol Cell Biol. 2003 May;23(9):3091-102. doi: 10.1128/MCB.23.9.3091-3102.2003. Mol Cell Biol. 2003. PMID: 12697811 Free PMC article. - Epigenetic therapy of cancer with histone deacetylase inhibitors.
Lakshmaiah KC, Jacob LA, Aparna S, Lokanatha D, Saldanha SC. Lakshmaiah KC, et al. J Cancer Res Ther. 2014 Jul-Sep;10(3):469-78. doi: 10.4103/0973-1482.137937. J Cancer Res Ther. 2014. PMID: 25313724 Review. - Class II histone deacetylases: structure, function, and regulation.
Bertos NR, Wang AH, Yang XJ. Bertos NR, et al. Biochem Cell Biol. 2001;79(3):243-52. Biochem Cell Biol. 2001. PMID: 11467738 Review.
Cited by
- Modulation of antigen-presenting cells by HDAC inhibitors: implications in autoimmunity and cancer.
Woan KV, Sahakian E, Sotomayor EM, Seto E, Villagra A. Woan KV, et al. Immunol Cell Biol. 2012 Jan;90(1):55-65. doi: 10.1038/icb.2011.96. Epub 2011 Nov 22. Immunol Cell Biol. 2012. PMID: 22105512 Free PMC article. Review. - Histone deacetylase 3 (HDAC3) activity is regulated by interaction with protein serine/threonine phosphatase 4.
Zhang X, Ozawa Y, Lee H, Wen YD, Tan TH, Wadzinski BE, Seto E. Zhang X, et al. Genes Dev. 2005 Apr 1;19(7):827-39. doi: 10.1101/gad.1286005. Genes Dev. 2005. PMID: 15805470 Free PMC article. - Zmynd15 encodes a histone deacetylase-dependent transcriptional repressor essential for spermiogenesis and male fertility.
Yan W, Si Y, Slaymaker S, Li J, Zheng H, Young DL, Aslanian A, Saunders L, Verdin E, Charo IF. Yan W, et al. J Biol Chem. 2010 Oct 8;285(41):31418-26. doi: 10.1074/jbc.M110.116418. Epub 2010 Jul 30. J Biol Chem. 2010. PMID: 20675388 Free PMC article. - Modulation of splicing events in histone deacetylase 3 by various extracellular and signal transduction pathways.
Gray SG, Iglesias AH, Teh BT, Dangond F. Gray SG, et al. Gene Expr. 2003;11(1):13-21. doi: 10.3727/000000003783992342. Gene Expr. 2003. PMID: 12691522 Free PMC article. - The human silent information regulator (Sir)2 homologue hSIRT3 is a mitochondrial nicotinamide adenine dinucleotide-dependent deacetylase.
Schwer B, North BJ, Frye RA, Ott M, Verdin E. Schwer B, et al. J Cell Biol. 2002 Aug 19;158(4):647-57. doi: 10.1083/jcb.200205057. Epub 2002 Aug 19. J Cell Biol. 2002. PMID: 12186850 Free PMC article.
References
- Taunton J, Hassig C A, Schreiber S L. Science. 1996;272:408–411. - PubMed
- Wade P A, Pruss D, Wolffe A P. Trends Biochem Sci. 1997;22:128–132. - PubMed
- Brownell J E, Zhou J, Ranalli T, Kobayashi R, Edmondson D G, Roth S Y, Allis C D. Cell. 1996;84:843–851. - PubMed
- Ogryzko V V, Schiltz R L, Russanova V, Howard B H, Nakatani Y. Cell. 1996;87:953–959. - PubMed
- Bannister A J, Kouzarides T. Nature (London) 1996;384:641–643. - PubMed
Publication types
MeSH terms
Substances
LinkOut - more resources
Full Text Sources
Other Literature Sources
Molecular Biology Databases
Research Materials
Miscellaneous


