Gating of recombinant small-conductance Ca-activated K+ channels by calcium - PubMed (original) (raw)
Comparative Study
Gating of recombinant small-conductance Ca-activated K+ channels by calcium
B Hirschberg et al. J Gen Physiol. 1998 Apr.
Abstract
Small-conductance Ca-activated K+ channels play an important role in modulating excitability in many cell types. These channels are activated by submicromolar concentrations of intracellular Ca2+, but little is known about the gating kinetics upon activation by Ca2+. In this study, single channel currents were recorded from Xenopus oocytes expressing the apamin-sensitive clone rSK2. Channel activity was detectable in 0.2 micro M Ca2+ and was maximal above 2 micro M Ca2+. Analysis of stationary currents revealed two open times and three closed times, with only the longest closed time being Ca dependent, decreasing with increasing Ca2+ concentrations. In addition, elevated Ca2+ concentrations resulted in a larger percentage of long openings and short closures. Membrane voltage did not have significant effects on either open or closed times. The open probability was approximately 0.6 in 1 micro M free Ca2+. A lower open probability of approximately 0.05 in 1 micro M Ca2+ was also observed, and channels switched spontaneously between behaviors. The occurrence of these switches and the amount of time channels spent displaying high open probability behavior was Ca2+ dependent. The two behaviors shared many features including the open times and the short and intermediate closed times, but the low open probability behavior was characterized by a different, long Ca2+-dependent closed time in the range of hundreds of milliseconds to seconds. Small-conductance Ca- activated K+ channel gating was modeled by a gating scheme consisting of four closed and two open states. This model yielded a close representation of the single channel data and predicted a macroscopic activation time course similar to that observed upon fast application of Ca2+ to excised inside-out patches.
Figures
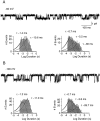
Figure 2
SK channel activity at different holding potentials. 1-s traces recorded from the patch in Fig. 1 exposed to 1.0 μM Ca2+ at membrane potentials of −60 and −100 mV (A and B, respectively). Channel openings are shown as downward deflections. Open-time (left) and closed-time (right) histograms are shown below each trace. Fitting a sum of two exponentials to the open-time distributions yielded at −60 mV: 1.4 ms, 40%; 10.6 ms, 60%; and at −100 mV: 1.2 ms, 40%; 11.0 ms, 60%. Fitting a sum of three exponentials to the closed-time distributions yielded at −60 mV: 0.74 ms, 57%; 5.2 ms, 25%; 36 ms, 18%; and at −100 mV: 0.65 ms, 58%; 3.6 ms, 28%; 26.7 ms, 14%. Relative amplitudes were obtained from the fitted exponential distributions.
Figure 3
Voltage independence of kinetic parameters. (A) Open probability is shown as a function of voltage for three patches individually. Values differed between patches, due to different intracellular Ca2+ concentrations (▴, ♦, 1 μM; ▪, 0.8 μM) and different types of channel behavior (high and low open probability behavior, see later), but for all patches open probability was essentially voltage independent. The line was drawn for display purposes only and has no physical meaning. (B) Average short and long open times for the patches in A. Data are shown as mean ± SD, and the lines represent the best fit of the data to single exponential functions. (C) Relative amplitude of the short open-time component as a function of voltage shown individually for each patch in A. The line was drawn for display purposes only. Data from each patch are represented by the same symbol in A, C, E, and F. (D) Short and intermediate closed times for the patches in A. Data are shown as mean ± SD and the lines represent the best fit of the data to exponential functions. (E) Long closed times shown for two patches individually and fit to a single exponential (solid lines). In the patch with the highest open probability, too few events were associated with the longest time constant to reliably fit this component. (F) Relative amplitudes of the short (closed symbols) and intermediate (open symbols) closed-time components plotted individually for the patches in A.
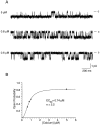
Figure 1
Calcium dependence of SK channel activity. (A) Recordings from an inside-out patch in different calcium concentrations at a holding potential of −80 mV. Traces show 2-s periods of the single channel recordings used to calculate the open probabilities in B. Channel openings are shown as downward deflections and calculated free intracellular [Ca2+] is noted on the left. Channel current was slightly smaller in the trace recorded in 5 μM Ca2+ due to an off-set of ∼11 mV that occurred upon switching to the EGTA-free solution (see
methods
). (B) Open probability as a function of intracellular calcium concentration. 30–60-s steady state recordings in 0.6, 0.8, 1.0, and 5.0 μM Ca2+ were used to calculate the open probability. Least squares fitting of the data to the Hill equation of the form P o = P o,max · [Ca2+]n/(EC50 _n_+ [Ca2+]n) (where P o,max is the maximal open probability in saturating [Ca2+], and other terms have their usual meanings) yielded P o,max = 81%, EC50 = 0.74 μM, and n = 2.2.
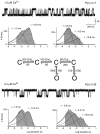
Figure 10
Simulation of SK channel activity using a sequential gating scheme. Traces were obtained from simulations of the gating scheme presented here. In this scheme, forward transitions between closed states are calcium dependent and are expressed as absolute rate constants in units of seconds−1 per micromolar−1, all other rates are in units of seconds−1. The rates for transitions between open and closed states were derived from the measured open and closed times, whereas the rates for transitions between closed states reflect the longest closed time as well as the relative contributions of different time constants. Simulations used the same acquisition rate and filter frequency as was used in single channel recordings, and simulated data were analyzed in the same manner as recorded data. Resulting open-duration histograms are shown on the left, closed-duration histograms on the right. Relative amplitudes of open-duration components were in 1.0 μM Ca2+: 1.2 ms, 29%; 12.6 ms, 71%; in 0.4 μM Ca2+: 1.0 ms, 51%; 12.2 ms, 49%. Relative amplitudes of closed-duration components were in 1.0 μM Ca2+: 0.8 ms, 71%; 6.3 ms, 21%; 18.8 ms, 8%; in 0.4 μM Ca2+: 0.8 ms, 49%; 4.4 ms, 33%; 53.9 ms, 18%.
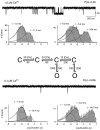
Figure 11
Simulation of low open probability behavior. Traces were obtained from simulations of the modified gating scheme shown in this figure. Calcium-dependent rates are lower by a factor of 6.7 compared with the gating scheme in Fig. 7 and are expressed as absolute rate constants in units of seconds−1 per micromolar−1, whereas all other rates are in units of seconds−1. Open-duration histograms are shown on the left, closed-duration histograms on the right. Relative amplitudes of open-duration components were in 1.0 μM Ca2+: 1.0 ms, 73%; 11.4 ms, 27%; in 0.4 μM Ca2+: 1.0 ms, 89%; 13.4 ms, 11%. Relative amplitudes of closed-duration components were in 1.0 μM Ca2+: 0.8 ms, 32%; 5.4 ms, 44%; 234 ms, 24%; in 0.4 μM Ca2+: 1.2 ms, 19%; 5.2 ms, 48%; 1,410 ms, 33%.
Figure 7
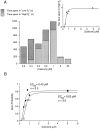
Calcium dependence of low and high open probability behavior. (A) Absolute recording time (in seconds) from all single channel patches combined during which low (dark gray) and high (light gray) open probability was observed. An open probability of <10% and the appearance of a closed-time constant >100 ms were taken as indicators of low open probability (see Fig. 8). The inset shows the fraction of the total recording time during which high open probability was observed and a fit of the data to the Hill equation yielding an EC50 of 0.52 μM and a Hill coefficient of 4.1. (B, •) The single channel open probability for a representative patch containing a channel displaying only high activity (P o(high)). (□) The “effective open probability” obtained by multiplying the single channel open probability by the relative time channels spent in high open probability behavior (P o(high) · f (high)) (Fig. 7_A, inset_). Lines represent fits to the Hill equation, yielding an EC50 of 0.43 μM and a Hill coefficient of 3.3 for the single channel open probability, and an EC50 of 0.63 μM and a Hill coefficient of 3.6 for the “effective open probability.”
Figure 8
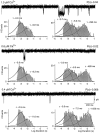
Low open probability SK channel behavior in different concentrations of calcium. Traces shown are from a single channel patch exposed to 1.0, 0.6, and 0.4 μM intracellular Ca2+. Scaling is the same for all traces, and open probabilities are noted above each trace. Open-duration histograms are displayed on the left and closed-duration histograms on the right. Solid lines and time constants represent maximum likelihood fits to the sum of two or three exponential components (see Fig. 3). Relative amplitudes of open- duration components were in 1.0 μM Ca2+: 0.9 ms, 71%; 9.8 ms, 29%; in 0.6 μM Ca2+: 0.8 ms, 80%; 8.3 ms, 20%; in 0.4 μM Ca2+: 0.9 ms, 83%; 11.6 ms, 17%. Relative amplitudes of closed-duration components were in 1.0 μM Ca2+: 0.7 ms, 41%; 6.2 ms, 27%; 293 ms, 32%; in 0.6 μM Ca2+: 0.9 ms, 39%; 6.5 ms, 27%; 489 ms, 34%; in 0.4 μM Ca2+: 0.9 ms, 31%; 7.5 ms, 26%; 1,050 ms, 43%.
Figure 4
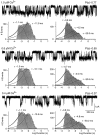
SK channel activity in different concentrations of Ca2+. Data shown are from a single channel patch voltage clamped at −80 mV. Scaling is the same for all traces and open probabilities are noted above each trace. Open-duration histograms are displayed on the left and closed-duration histograms on the right underneath the corresponding 2-s traces. Solid lines and time constants represent maximum likelihood fits to the sum of two or three exponential components shown for each component separately as well as for the sum. Relative amplitudes of open-duration components were in 1.0 μM Ca2+: 1.1 ms, 34%; 11.9 ms, 66%; in 0.6 μM Ca2+: 1.0 ms, 43%; 10.1 ms, 57%; in 0.4 μM Ca2+: 1.1 ms, 51%; 13.5 ms, 49%. Relative amplitudes of closed-duration components were in 1.0 μM Ca2+: 0.8 ms, 71%; 4.2 ms, 19%; 20.0 ms, 10%; in 0.6 μM Ca2+: 0.7 ms, 67%; 4.0 ms, 23%; 32.6 ms, 10%; in 0.4 μM Ca2+: 0.8 ms, 63%; 4.8 ms, 25%; 60.2 ms, 12%.
Figure 5
Calcium dependence of channel open and closed durations. Data were from five excised patches, each containing a single channel displaying high open probability behavior (see text). Except in C, lines were drawn to illustrate the Ca2+ independence of the kinetic parameters and are not intended to have physical meaning. (A) Average short and long open times were independent of intracellular Ca2+ concentration. (B) Average short and intermediate closed-times were independent of Ca2+ concentration. (C) Ca2+ dependence of the average long closed times. Linear regression analysis of the means yielded a slope of −66 ms μM−1. (D) The relative amplitude of the short open-time component decreased as a function of Ca2+ concentration. (E) The relative amplitude of the short closed-time component increased with increasing Ca2+ concentration. (F) Increasing Ca2+ concentrations lead to a decrease in the relative amplitude of the long closed-time component.
Figure 6
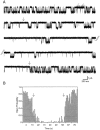
Low and high open probability behavior. The traces in A show 20 s of a recording from a single channel patch voltage clamped at −100 mV starting 11 s after excision into 1.0 μM free Ca2+. The parallel lines mark a 32-s break in the continuously acquired recording. Approximately 19 s after patch excision (arrow), channel open probability decreased from ∼60% to <10%. During the same continuous recording, ∼63 s after patch excision (second arrow), channel open probability spontaneously increased to its starting level. B shows the open probability during 1-s intervals as a function of time after patch excision with the arrows indicating the switches in channel activity (same as A).
Figure 9
Calcium dependence of kinetic parameters describing low open probability behavior. Data are from three single channel patches except in 0.2 μM Ca2+ (one patch) and in 0.6 μM Ca2+ (two patches) during periods of low open probability activity. (A) Average short and long open times were independent of intracellular Ca2+ concentration. Linear regression analysis of the data is shown as the solid lines and illustrates the Ca2+ independence of the open-time constants. (B) Average short and intermediate closed times were independent of Ca2+ concentration. Solid lines represent linear regression analysis. (C) The long closed times during low open probability activity was Ca2+ dependent, similar to what was observed during high channel open probability (compare Fig. 5). Linear regression analysis yielded a slope of −2,460 ms μM−1. (D) The relative amplitude of the short open-time component decreased as a function of Ca2+ concentration. Data are shown on a semi-logarithmic scale for comparison with Fig. 5 (high open probability behavior). The line in D–F is included for display purposes only. (E) The relative amplitude of the short closed-time component increased with increasing Ca2+ concentration. (F) Increasing Ca2+ concentrations lead to a decrease in the relative amplitude of the long closed-time component.
Figure 12
Correlations between successive openings. (A) Open-duration histograms for the patch in Fig. 4 exposed to 0.4 μM Ca2+ including all openings (left), openings after openings shorter than 1 ms (middle), and openings after openings longer than 10 ms (right). The lifetimes and relative amplitudes of the two components were 1.1 ms, 51%, and 13.5 ms for all openings; 1.1 ms, 80%, and 15.8 ms after short openings; and 1.3 ms, 26%, and 14.0 ms after long openings. Insets show corresponding histograms for simulations of the model in Fig. 10. The short and long components had lifetimes of 1.0 ms, 51%, and 12.2 ms for all openings; 1.0 ms, 77%, and 12.3 ms after short openings; and 1.1 ms, 19%, and 12.8 ms after long openings. (B) Open-duration histograms for the channel in Fig. 7 displaying low open probability behavior in 1.0 μM Ca2+. Open times were fit to two components with lifetimes of 0.9 ms, 71%, and 9.8 ms (left). Openings after openings shorter than 1 ms (middle) had lifetimes of 0.7 ms, 92%, and 8.8 ms. Openings after openings longer than 10 ms (right) were predominantly long but could not be fit due to the small number of events. Insets show corresponding histograms for the model in Fig. 11. The two components had lifetimes of 1.0 ms, 73%, and 11.4 ms for all openings; 1.0 ms, 91%, and 9.1 ms after short openings; and 1.2 ms, 24%, and 13.3 ms after long openings.
Figure 13
Time dependence of the macroscopic current activation. (A) An inside-out macropatch excised from an oocyte expressing SK2 was positioned near a solution interface formed by a continuous flow through a θ tube of 0 and 9.5 μM Ca2+. At a holding potential of −80 mV, Ca2+ was pulsed on and off by rapidly moving the solution interface across the patch pipette tip using a bimorph translator (Morgan Matroc Inc., Bedford, OH) attached to the θ tube. The rising and falling phase of activation and deactivation, respectively, were well described by single exponentials, yielding time constants of 4.9 and 58 ms. Overlaid on the data is a simulation of the model in Fig. 10. (B) Computer simulations of the gating scheme in Fig. 10 for 400 ms Ca2+-jumps from 0 to the Ca2+ concentration indicated above each trace. For each trace, the rising and falling phase of the activation and deactivation time course, respectively, were fit to single exponential functions with the fitted lines coinciding with the traces. The deactivation time course was independent of the Ca2+ concentration during the jump and gave a time constant of 76 ms. (C) Ca2+ dependence of the activation time course. Activation time-constants obtained from fitting the macroscopic current activation (○) and the simulated traces in B (•) were plotted as a function of Ca2+concentration. Over the range of 0.2 to 10 μM Ca2+, the Ca2+ dependence of the simulated data appeared linear and regression analysis yielded an apparent Ca2+-binding rate of 47 μM−1 s−1.
Similar articles
- Gating kinetics of single large-conductance Ca2+-activated K+ channels in high Ca2+ suggest a two-tiered allosteric gating mechanism.
Rothberg BS, Magleby KL. Rothberg BS, et al. J Gen Physiol. 1999 Jul;114(1):93-124. doi: 10.1085/jgp.114.1.93. J Gen Physiol. 1999. PMID: 10398695 Free PMC article. - Distinct effects of Ca2+ and voltage on the activation and deactivation of cloned Ca(2+)-activated K+ channels.
DiChiara TJ, Reinhart PH. DiChiara TJ, et al. J Physiol. 1995 Dec 1;489 ( Pt 2)(Pt 2):403-18. doi: 10.1113/jphysiol.1995.sp021061. J Physiol. 1995. PMID: 8847636 Free PMC article. - Wanderlust kinetics and variable Ca(2+)-sensitivity of Drosophila, a large conductance Ca(2+)-activated K+ channel, expressed in oocytes.
Silberberg SD, Lagrutta A, Adelman JP, Magleby KL. Silberberg SD, et al. Biophys J. 1996 Jun;70(6):2640-51. doi: 10.1016/S0006-3495(96)79833-8. Biophys J. 1996. PMID: 8744301 Free PMC article. Corrected and republished. - Small conductance calcium-activated potassium channels: from structure to function.
Weatherall KL, Goodchild SJ, Jane DE, Marrion NV. Weatherall KL, et al. Prog Neurobiol. 2010 Jul;91(3):242-55. doi: 10.1016/j.pneurobio.2010.03.002. Epub 2010 Mar 30. Prog Neurobiol. 2010. PMID: 20359520 Review. - Structure, Gating and Basic Functions of the Ca2+-activated K Channel of Intermediate Conductance.
Sforna L, Megaro A, Pessia M, Franciolini F, Catacuzzeno L. Sforna L, et al. Curr Neuropharmacol. 2018;16(5):608-617. doi: 10.2174/1570159X15666170830122402. Curr Neuropharmacol. 2018. PMID: 28875832 Free PMC article. Review.
Cited by
- Phase response curve analysis of a full morphological globus pallidus neuron model reveals distinct perisomatic and dendritic modes of synaptic integration.
Schultheiss NW, Edgerton JR, Jaeger D. Schultheiss NW, et al. J Neurosci. 2010 Feb 17;30(7):2767-82. doi: 10.1523/JNEUROSCI.3959-09.2010. J Neurosci. 2010. PMID: 20164360 Free PMC article. - Regional differences in distribution and functional expression of small-conductance Ca2+-activated K+ channels in rat brain.
Sailer CA, Hu H, Kaufmann WA, Trieb M, Schwarzer C, Storm JF, Knaus HG. Sailer CA, et al. J Neurosci. 2002 Nov 15;22(22):9698-707. doi: 10.1523/JNEUROSCI.22-22-09698.2002. J Neurosci. 2002. PMID: 12427825 Free PMC article. - Ionic mechanisms and Ca2+ dynamics underlying the glucose response of pancreatic β cells: a simulation study.
Cha CY, Nakamura Y, Himeno Y, Wang J, Fujimoto S, Inagaki N, Earm YE, Noma A. Cha CY, et al. J Gen Physiol. 2011 Jul;138(1):21-37. doi: 10.1085/jgp.201110611. J Gen Physiol. 2011. PMID: 21708953 Free PMC article. - Role of SK(Ca) and IK(Ca) in endothelium-dependent hyperpolarizations of the guinea-pig isolated carotid artery.
Gluais P, Edwards G, Weston AH, Falck JR, Vanhoutte PM, Félétou M. Gluais P, et al. Br J Pharmacol. 2005 Feb;144(4):477-85. doi: 10.1038/sj.bjp.0706003. Br J Pharmacol. 2005. PMID: 15655533 Free PMC article. - Identification and functional characterization of the intermediate-conductance Ca(2+)-activated K(+) channel (IK-1) in biliary epithelium.
Dutta AK, Khimji AK, Sathe M, Kresge C, Parameswara V, Esser V, Rockey DC, Feranchak AP. Dutta AK, et al. Am J Physiol Gastrointest Liver Physiol. 2009 Nov;297(5):G1009-18. doi: 10.1152/ajpgi.00223.2009. Am J Physiol Gastrointest Liver Physiol. 2009. PMID: 20501432 Free PMC article.
References
- Adelman JP, Shen K-Z, Kavanaugh MP, Warren RA, Wu Y-N, Lagrutta A, Bond CT, North RA. Calcium-activated potassium channels expressed from cloned complementary DNAs. Neuron. 1992;9:209–216. - PubMed
- Blatz AL, Magleby KL. Single apamin-blocked Ca-activated K+channels of small conductance in cultured rat skeletal muscle. Nature. 1986;323:718–720. - PubMed
- Blatz AL, Magleby KL. Calcium-activated potassium channels. Trends Neurosci. 1987;10:463–467.
- Colquhoun, D., and F.J. Sigworth. 1983. Fitting and statistical analysis of single-channel records. In Single-Channel Recording. B. Sakman and E. Neher, editors. Plenum Publishing Corp., New York. 191–263.
Publication types
MeSH terms
Substances
LinkOut - more resources
Full Text Sources
Molecular Biology Databases
Miscellaneous
