Modulation of Sp1 phosphorylation by human immunodeficiency virus type 1 Tat - PubMed (original) (raw)
Modulation of Sp1 phosphorylation by human immunodeficiency virus type 1 Tat
R F Chun et al. J Virol. 1998 Apr.
Abstract
We previously reported (K. T. Jeang, R. Chun, N. H. Lin, A. Gatignol, C. G. Glabe, and H. Fan, J. Virol. 67: 6224-6233, 1993) that human immunodeficiency virus type 1 (HIV-1) Tat and Sp1 form a protein-protein complex. Here, we have characterized the physical interaction and a functional consequence of Tat-Sp1 contact. Using in vitro protein chromatography, we mapped the region in Tat that contacts Sp1 to amino acids 30 to 55. We found that in cell-free reactions, Tat augmented double-stranded DNA-dependent protein kinase (DNA-PK)-mediated Sp1 phosphorylation in a contact-dependent manner. Tat mutants that do not bind Sp1 failed to influence phosphorylation of the latter. In complementary experiments, we also found that Tat forms protein-protein contacts with DNA-PK. We confirmed that in HeLa and Jurkat cells, Tat expression indeed increased the intracellular amount of phosphorylated Sp1 in a manner consistent with the results of cell-free assays. Furthermore, using two phosphatase inhibitors and a kinase inhibitor, we demonstrated a modulation of reporter gene expression as a consequence of changes in Sp1 phosphorylation. Taken together, these findings suggest that activity at the HIV-1 promoter is influenced by phosphorylation of Sp1 which is affected by Tat and DNA-PK.
Figures
FIG. 1
Definition of the region within Tat that binds Sp1. (A) Binding of Sp1 to GST, GST-Tat, or GST-Tat C-terminal mutants affixed to a solid matrix was assessed by immunoblotting of column elutions using rabbit polyclonal antibody (left). Protein column chromatography was performed as described in Materials and Methods. FT, flowthrough; W, wash fraction (0.1 M KCl). The 0.25, 0.5, and 1.0 M KCl buffer elutions are indicated; Sp1 indicates the lane in which purified protein (Promega) was loaded as a control. A Coomassie blue-stained gel of the purified GST-Tat fusion proteins used in constructing immobilized column matrices is shown to the right. (B) Western blot identifying Sp1 in elutions from columns constructed using GST, GST-Tat, or GST-Tat N-terminal mutants. A Coomassie blue-stained gel of the GST-Tat fusion proteins is shown to the right.
FIG. 2
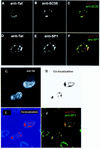
Colocalization of Sp1 and Tat in transfected HeLa cells. (A) Tat localization in HeLa cells transfected with Tat expression plasmid and stained in parallel for Tat (anti-Tat rabbit primary antibody and Texas red-conjugated goat anti-rabbit second antibody) and SC35 (anti-SC35 mouse monoclonal primary antibody and FITC-conjugated goat anti-mouse second antibody). In panel A, only the Tat visualization window is shown. (B) Visualization of SC35 in the cell shown in panel A. (C) Computer colocalization analysis of the signals shown in panels A and B, with Tat staining indicated by red and SC35 staining indicated by green. Areas of colocalization are indicated in yellow. (D) Tat localization in HeLa cells transfected with Tat expression plasmid and stained in parallel for Tat (anti-Tat rat primary antibody and Texas red-conjugated goat anti-rat second antibody) and Sp1 (rabbit anti-Sp1 primary antibody and FITC-conjugated goat anti-rabbit second antibody). Only the Tat window is shown. (E) Visualization of Sp1 in the cell shown in panel D. (F) Colocalization analysis of panels D and E, with Tat staining highlighted by red and Sp1 staining highlighted by green. Areas of colocalization between Tat and Sp1 are indicated in yellow. (G) Additional views of cells transfected with a Tat-expressing plasmid and stained with rat antiserum to Tat and rabbit polyclonal antiserum to Sp1. The confocal image capture window was set for the anti-Tat signal. (H and I) Computer-assisted colocalization of Tat and Sp1 signals shown in black (H) and red (I). (J) Confocal micrograph with fluorescence window adjusted to capture anti-Tat (red), anti-Sp1 (green), and colocalized images of the two proteins (yellow). This field of cells is identical to that in panel G. (K and L) Lower-magnification views of the same field of cells transfected with a Tat-expressing plasmid stained with rat anti-Tat and rabbit anti-Sp1. The fluorescence image capture window was restricted to either anti-Tat (K) or anti-Sp1 (L).
FIG. 3
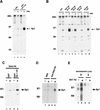
Tat affects phosphorylation of Sp1 in vitro. (A) In vitro kinase reaction of Sp1 using HeLa cellular extract. The effect of purified GST-Tat 1-101 on Sp1 phosphorylation is compared to that of purified GST alone. Four micrograms of cell extract was mixed with 100 ng of GST alone or GST-Tat 1-101 and 200 ng of purified Sp1. +’s mark lanes that contain 100 ng of double-stranded oligonucleotides comprised of Sp1 and TATA motifs from HIV-1. After 15 min of incubation on ice, kinase buffer was added, and the samples were incubated for an additional 15 min at room temperature. Reactions were terminated by addition of SDS-PAGE sample buffer and were analyzed by SDS-PAGE (10% gel) followed by autoradiography or Fuji phosphorimaging. The arrow indicates the position of phosphorylated Sp1. Identity of phosphorylated Sp1 was also confirmed separately by direct immunoprecipitation using specific antibody (data not shown). (B) Delineation of the in vitro modulatory effect on Sp1 phosphorylation by four GST-Tat mutants. Note that GST-Tat 20-72, GST-Tat 30-72, and His-Tat 1-66 can all bind Sp1, while GST-Tat 40-72 cannot (Fig. 1B). Phosphorylation of Sp1 was augmented by GST-Tat 20-72, GST-Tat 30-72, and His-Tat 1-66 but not by GST-Tat 40-72. By laser densitometry (Molecular Dynamics), GST-Tat 20-72 showed a 5-fold increase over GST, while GST-Tat 30-72 and His-Tat 1-66 showed increases of 3- and 2.5-fold, respectively. (C) In vitro kinase reactions were performed without (−) or with (+) double-stranded DNA as for panel A except that 250 ng of purified DNA-PK was used in place of HeLa nuclear extract. (D) Verification of the involvement of DNA-PK by direct immunoprecipitation. In vitro kinase reactions were performed as for panel A except that the source of DNA-PK was immunoprecipitation using specific antiserum to DNA-PK (lanes 3 and 4) of HeLa cell extract. As negative controls, immunoprecipitation were performed with normal rabbit serum (NRS; lanes 1 and 2). All four samples contain double-stranded oligonucleotides with Sp1 and TATA motifs from HIV-1. In lanes 1 and 3, GST alone was used in place of GST-Tat 1-101. (E) In vitro kinase reactions were performed as for panel A except that wortmannin (Calbiochem) was added to the incubations in lanes 3 and 4. All samples contain double-stranded oligonucleotides with Sp1 and TATA motifs from HIV-1 and GST alone (−) or GST-Tat 1-101 (+). The arrow points to the migration position of exogenously added purified Sp1. Sizes are indicated in kilodaltons.
FIG. 4
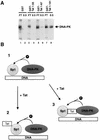
DNA-PK binds Tat. (A) HeLa cell extracts were equilibrated with either GST or GST-Tat protein columns. Columns were extensively washed (>20 column volumes) with 0.1 M KCl buffer and then eluted with 0.5 M KCl buffer. Eluates were assayed for DNA-PK by immunoblotting using rabbit polyclonal antibody to DNA-PK (Serotec). Flowthrough (FT) and 0.5 M KCl elutions are indicated. Note that neither GST alone (lane 2) nor GST-Tat 1-55 bound DNA-PK (lane 4); GST-Tat 1-67 (lane 6) bound DNA-PK less strongly than GST-Tat 1-101 (lane 8). (B) Schematic diagram of possible interactions between Sp1, DNA-PK, and Tat. In diagram 1, phosphorylation as indicated by the dotted arrow occurs in the absence of Tat. In diagram 2, Tat interaction with Sp1 induces a conformational change in Sp1, enhancing its ability to become phosphorylated. In diagram 3, Tat bridges Sp1 and DNA-PK, facilitating Sp1 phosphorylation. The ability of Tat to contact directly both Sp1 and DNA-PK is consistent with events in diagram 3.
FIG. 5
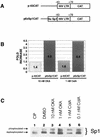
Effects of phosphatase inhibitors (okadaic acid and calyculin A) on Sp1-dependent expression. (A) Schematic representations of reporter plasmids. p-43CAT contains the HIV-LTR minimal promoter (nucleotides −43 to +78). p6xSp1CAT contains the HIV-LTR minimal promoter with six consensus Sp1-binding sites positioned upstream of TATAA. (B) Bar graph of CAT assays. HeLa cells were transfected with the indicated plasmids. In all cases, pUC19 was used to normalize for total amounts of DNA. A total of 2.5 μg of DNA was used per transfection. Phosphatase inhibitors were introduced into the media at the indicated concentrations 3 h before transfection and were maintained continuously. CAT activities were visualized by phosphorimaging. Data are averages from triplication (okadaic acid [OKA]) and duplication (calyculin A [CalA]). Amounts of activity were measured by scintillation counting of silica plate slices. (C) Western blot of Sp1 from HeLa cells treated with the indicated phosphatase inhibitors. Samples were separated in an SDS–12.5% (12.4:0.1, acrylamide/bisacrylamide) polyacrylamide gel that enhances migration differences between phosphorylated and nonphosphorylated forms of Sp1. The arrows indicate the relative positions of the two forms of Sp1. Calf intestinal alkaline phosphatase (CIP)-treated extract shows the migration profile of dephosphorylated Sp1 (lane 1). Treatment with phosphatase inhibitors increased the amount of phosphorylated relative to dephosphorylated Sp1.
FIG. 6
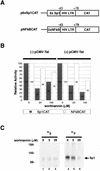
Effects of wortmannin, a DNA-PK inhibitor, on Sp1-dependent expression. (A) Schematic representations of reporters. p6xSp1CAT contains the HIV-1 minimal promoter (nucleotides −43 to +78) with six consensus Sp1 binding sites positioned upstream of TATAA. pNF-κBCAT contains the HIV-1 minimal promoter and two NF-κB sites positioned upstream of TATAA. (B) Bar graph (average of two experiments) of CAT assays performed in the presence of different concentrations of wortmannin. Activity measured at 0 mM wortmannin was set as 100%. The reporter plasmids (1 μg) are as in panel A. Assays with (pCMV-Tat; right) and without (-pCMV-Tat; left) the addition of a Tat expression plasmid (100 ng) are shown. (C) Cells were treated with the indicated amounts of wortmannin at the same time as with [35S]methionine-cysteine and 32Pi overnight labeling. HeLa cell extracts were immunoprecipitated with anti-Sp1 serum and resolved by SDS-PAGE (10% gel). Benchmark (Life Technologies) molecular weight marker positions are indicated in kilodaltons on the left. Equivalent amounts of total protein were immunoprecipitated as quantitated by TCA precipitation and scintillation counting.
FIG. 7
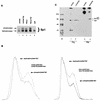
Increased phosphorylation of Sp1 in Tat-expressing cells. (A) Western analysis of Jurkat, Jurkat-Tat, HeLa, and HeLa-Tat cell extracts, using rabbit anti-Sp1 serum. Blots were developed by using chemiluminescence. Lanes were normalized for duration of exposure. (B) Densitometer (Molecular Dynamics) tracings of Western blot signals comparing the amounts of phosphorylated and dephosphorylated Sp1 in Jurkat (31.6% phosphorylated) and Jurkat-Tat (39.3% phosphorylated; left) and in HeLa (21.5% phosphorylated) and HeLa-Tat (34.4% phosphorylated; right) cells. (C) [35S]methionine-cysteine and 32Pi-labeled HeLa cell proteins were immunoprecipitated with anti-Sp1 serum. Equivalent amounts of total protein were immunoprecipitated as quantitated by TCA precipitation and scintillation counting. Images were visualized with a Fuji phosphorimaging system, and exposures were normalized for total amounts of signal. Greater amounts of phosphorylated Sp1 was observed for Jurkat-Tat than for Jurkat, while amount of 35S labeled-Sp1 was recovered in essentially identical amounts from the two cell lines. M, size markers (positions are indicated in kilodaltons).
FIG. 8
A point mutation at serine 131 in Sp1 reduces Tat transactivation. (A) Schematic representations of point mutations. Gal-Sp1A contains the N-terminal A domain of Sp1 (from amino acids 1 to 169), while Gal-Sp1Gln has the N-terminal serine/threonine-rich portion (amino acids 1 to 55) deleted. Relative locations of point mutations are indicated by X. M1, serine 112 to alanine; M2, serine 131 to alanine; M3, serine 158 to alanine. Combinations are indicated as M1,2, M1,3, etc. Gal-Sp1ΔGln is a C-terminal deletion (amino acids 118 to 169 removed) of Gal-Sp1Gln; serines 131 and 158 are absent from this construct. The amino acid position assignments are relative to the Sp1 sequence in GenBank (accession no. J03133). All mutations were verified directly by sequencing (data not shown). DBD, DNA-binding domain. (B) CAT assays of the various Gal-Sp1Gln mutant individually tested in the presence of coexpressed Tat protein. HeLa cells were transfected with Gal-HIV-1 LTR-CAT reporter, pSV-Tat expression plasmid, and one of the Gal-Sp1Gln mutants (-M1, -M2, or -M3). Each set of transfections used either 5 (left) or 1 (right) μg of Gal-Sp1 mutant plasmid. With the lower activity level of Sp1Gln arbitrarily set as 1, the comparable average relative activities from the mutants are as follows: M1, 1.3; M2, 0.05; M3, 1.1; M1,2, 0.02; M1,3, 1.5; M1,2,3, 0.02; M2,3, 0.1; and Sp1ΔGln, 0.1. AcCm, acetylated chloramphenicol; Cm, chloramphenicol. (C) Immunoprecipitation of Gal-Sp1 proteins. HeLa cells transfected with the indicated plasmids were labeled overnight with [35S]methionine-cysteine (lanes 1 to 4) or 32Pi (lanes 5 to 8). The cells were lysed in RIPA buffer and immunoprecipitated with antiserum raised to the Gal DNA-binding domain. The immunoprecipitates were resolved by SDS-PAGE (14% gel) followed by autoradiography. Arrows and asterisks indicate the positions of relevant bands. Note the absence of 32P-labeled immunoprecipitated band in Gal-Sp1GlnM2 (compare lanes 4 and 8).
FIG. 9
Mutation at serine 131 affects DNA-PK-mediated phosphorylation of Sp1. Sp1Gln, Sp1GlnM2, and Sp1ΔGln proteins were expressed and purified as GST fusion proteins. (A) Purified proteins stained by Coomassie brilliant blue. Arrow points to the migration position of Sp1Gln and Sp1GlnM2. Sp1ΔGln (lane 3) migrates with an apparent size that is approximately 5 kDa smaller than either Sp1Gln (lane 1) or Sp1GlnM2 (lane 2). (B) DNA-PK (purified enzyme purchased from Promega)-mediated transfer of 32P from [γ-32P]ATP to Sp1Gln (lane 1), Sp1GlnM2 (lane 2), or Sp1ΔGln (lane 3) in the absence (left) or presence (right) of double-stranded oligonucleotides. Arrow points to phosphorylated Sp1Gln protein seen only in the reaction supplemented with DNA (lane 1, right).
FIG. 10
Correlation between mutant Tat proteins that bind Sp1 and interference with HIV-1 growth in C8166-45 T-cells. (A) Schematic representation of virus constructions. Mutant Tat (m-Tat) cDNAs were positioned in frame into nef of pNL4-3. Note that these chimeric proviruses produce both wild-type (wt-Tat) and mutant Tat proteins. (B) RT growth curves for viruses propagated in C8166-45. Data are representative of points from experiment 2 (Fig. 9C). (C) Summary from three separate experiments of the times of peak RT produced by the different viruses. (D) Interpretive model of the competition between mutant and wild-type Tat proteins for binding to Sp1. (E) Transdominant inhibitory activity of Tat fragments expressed from proviral constructions. In this assay, 0.1 μg of pLTR-CAT was transfected into HeLa cells with 2 μg of pUC19 alone (lane 1) or with 0.1 μg of pSV-Tat plus 2 μg of either pNL4-3 provirus (lane 2), Tat 20-58 provirus (lane 3), Tat 30-58 provirus (lane 4), Tat 30-72 provirus (lane 5), or Tat 30-72i provirus (lane 6). CAT activities were assayed 48 h after transfection. Under these transfection conditions, activity from 0.1 μg of pLTR-CAT is saturated by cotransfection with 0.1 μg of pSV-Tat since when 0.1 μg of pLTR-CAT and 0.1 μg of pSV-Tat were transfected together (data not shown), CAT activity was equivalent to that shown in lane 2. AcCm, acetylated chloramphenicol; Cm, chloramphenicol.
Similar articles
- Human immunodeficiency virus type 1 Tat prevents dephosphorylation of Sp1 by TCF-4 in astrocytes.
Rossi A, Mukerjee R, Ferrante P, Khalili K, Amini S, Sawaya BE. Rossi A, et al. J Gen Virol. 2006 Jun;87(Pt 6):1613-1623. doi: 10.1099/vir.0.81691-0. J Gen Virol. 2006. PMID: 16690926 - In vitro and in vivo binding of human immunodeficiency virus type 1 Tat protein and Sp1 transcription factor.
Jeang KT, Chun R, Lin NH, Gatignol A, Glabe CG, Fan H. Jeang KT, et al. J Virol. 1993 Oct;67(10):6224-33. doi: 10.1128/JVI.67.10.6224-6233.1993. J Virol. 1993. PMID: 7690421 Free PMC article. - Sp1 transcription factor is required for in vitro basal and Tat-activated transcription from the human immunodeficiency virus type 1 long terminal repeat.
Suñé C, García-Blanco MA. Suñé C, et al. J Virol. 1995 Oct;69(10):6572-6. doi: 10.1128/JVI.69.10.6572-6576.1995. J Virol. 1995. PMID: 7666561 Free PMC article. - The Sp1 transcription factor does not directly interact with the HIV-1 Tat protein.
Loregian A, Bortolozzo K, Boso S, Sapino B, Betti M, Biasolo MA, Caputo A, Palú G. Loregian A, et al. J Cell Physiol. 2003 Aug;196(2):251-7. doi: 10.1002/jcp.10271. J Cell Physiol. 2003. PMID: 12811817 - Artificial zinc finger fusions targeting Sp1-binding sites and the trans-activator-responsive element potently repress transcription and replication of HIV-1.
Kim YS, Kim JM, Jung DL, Kang JE, Lee S, Kim JS, Seol W, Shin HC, Kwon HS, Van Lint C, Hernandez N, Hur MW. Kim YS, et al. J Biol Chem. 2005 Jun 3;280(22):21545-52. doi: 10.1074/jbc.M414136200. Epub 2005 Mar 2. J Biol Chem. 2005. PMID: 15743774
Cited by
- Post-translational control of sp-family transcription factors.
Waby JS, Bingle CD, Corfe BM. Waby JS, et al. Curr Genomics. 2008;9(5):301-11. doi: 10.2174/138920208785133244. Curr Genomics. 2008. PMID: 19471608 Free PMC article. - Human T-cell leukemia virus type 1 Tax shuttles between functionally discrete subcellular targets.
Burton M, Upadhyaya CD, Maier B, Hope TJ, Semmes OJ. Burton M, et al. J Virol. 2000 Mar;74(5):2351-64. doi: 10.1128/jvi.74.5.2351-2364.2000. J Virol. 2000. PMID: 10666266 Free PMC article. - Regulation of HIV-1 transcription at 3% versus 21% oxygen concentration.
Charles S, Ammosova T, Cardenas J, Foster A, Rotimi J, Jerebtsova M, Ayodeji AA, Niu X, Ray PE, Gordeuk VR, Kashanchi F, Nekhai S. Charles S, et al. J Cell Physiol. 2009 Nov;221(2):469-79. doi: 10.1002/jcp.21882. J Cell Physiol. 2009. PMID: 19626680 Free PMC article. - Post-translational Modification-Based Regulation of HIV Replication.
Chen L, Keppler OT, Schölz C. Chen L, et al. Front Microbiol. 2018 Sep 11;9:2131. doi: 10.3389/fmicb.2018.02131. eCollection 2018. Front Microbiol. 2018. PMID: 30254620 Free PMC article. Review. - Regulation of HIV-1 transcription in cells of the monocyte-macrophage lineage.
Kilareski EM, Shah S, Nonnemacher MR, Wigdahl B. Kilareski EM, et al. Retrovirology. 2009 Dec 23;6:118. doi: 10.1186/1742-4690-6-118. Retrovirology. 2009. PMID: 20030845 Free PMC article. Review.
References
- Anderson C W, Lees-Miller S P. The nuclear serine/threonine protein kinase DNA-PK. Crit Rev Eukaryotic Gene Expression. 1992;2:283–314. - PubMed
- Armstrong S A, Barry D A, Leggett R W, Mueller C R. Casein kinase II-mediated phosphorylation of the C terminus of Sp1 decreases its DNA binding activity. J Biol Chem. 1997;272:13489–13495. - PubMed
- Ausubel F M, Brent R, Kingston R E, Moore D D, Smith J A, Seidman J G, Struhl K, editors. Current protocols in molecular biology. New York, N.Y: John Wiley & Sons; 1987.
- Berkhout B, Gatignol A, Rabson A B, Jeang K T. TAR-independent activation of the HIV-1 LTR: evidence that tat requires specific regions of the promoter. Cell. 1990;62:757–767. - PubMed
Publication types
MeSH terms
Substances
LinkOut - more resources
Full Text Sources
Other Literature Sources

