The I domain is required for efficient plasma membrane binding of human immunodeficiency virus type 1 Pr55Gag - PubMed (original) (raw)
The I domain is required for efficient plasma membrane binding of human immunodeficiency virus type 1 Pr55Gag
S Sandefur et al. J Virol. 1998 Apr.
Abstract
The interaction of the human immunodeficiency virus type 1 (HIV-1) Pr55Gag molecule with the plasma membrane of an infected cell is an essential step of the viral life cycle. Myristic acid and positively charged residues within the N-terminal portion of MA constitute the membrane-binding domain of Pr55Gag. A separate assembly domain, termed the interaction (I) domain, is located nearer the C-terminal end of the molecule. The I domain is required for production of dense retroviral particles, but has not previously been described to influence the efficiency of membrane binding or the subcellular distribution of Gag. This study used a series of Gag-green fluorescent protein fusion constructs to define a region outside of MA which determines efficient plasma membrane interaction. This function was mapped to the nucleocapsid (NC) region of Gag. The minimal region in a series of C-terminally truncated Gag proteins conferring plasma membrane fluorescence was identified as the N-terminal 14 amino acids of NC. This same region was sufficient to create a density shift in released retrovirus-like particles from 1.13 to 1.17 g/ml. The functional assembly domain previously termed the I domain is thus required for the efficient plasma membrane binding of Gag, in addition to its role in determining the density of released particles. We propose a model in which the I domain facilitates the interaction of the N-terminal membrane-binding domain of Pr55Gag with the plasma membrane.
Figures
FIG. 1
Construction of Gag-GFP chimeric constructs. (A) The initial panel of Gag-GFP constructs. Shaded regions represent the 27-kDa GFP protein fused to truncated or full-length HIV Gag protein (open bars). The number above the fusion site represents the C-terminal Gag residue expressed (numbered from the amino acid sequence of HXB2CG, with the initiator methionine as residue 1). Note that GAGB/GFP and GAGP/GFP utilize restriction sites as the sites of truncation of Gag and fusion to GFP; fusion sites for the other constructs were created at proteolytic cleavage sites (MA/GFP and MACA/GFP) or following the final residue of Gag (55GAG/GFP) by PCR cloning techniques. (B) Gag-GFP chimeric constructs subdividing HIV NC. Asterisks indicate the sites of Gag truncation and fusion with GFP; numbering is as in panel A. Cleavage sites used by HIV protease are indicated by arrows.
FIG. 2
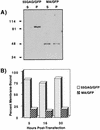
Differential sedimentation analysis of Gag-GFP fusion constructs. (A) Western blot of soluble (S) and pellet (P) fractions from cells expressing 55GAG/GFP and MA/GFP. The positions of molecular mass markers are indicated in kilodaltons at the left. (B) Quantitation of Gag-GFP membrane binding by fluorescence spectrophotometry. Results of differential sedimentation for identically transfected cells collected at three different time points are shown. Percent membrane-bound protein was calculated as protein in membrane-enriched pellet/protein in pellet plus protein in supernatant.
FIG. 3
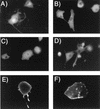
Epifluorescence microscopy of BSC-40 cells expressing the Gag-GFP fusion constructs. Photographs were obtained 5 h after transfection with the indicated Gag-GFP expression plasmid. Photographs were taken of unfixed cells attached to a glass coverslip and are representative of more than 80% of Gag-GFP-expressing cells viewed for each construct. (A) GFP control; (B) MA/GFP; (C) GAGP/GFP; (D) MACA/GFP; (E) GAGB/GFP; (F) 55GAG/GFP.
FIG. 4
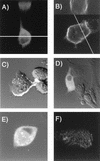
Laser scanning confocal microscopy of BSC-40 cells expressing Gag-GFP constructs. Digital images of living cells were acquired with a Zeiss LSM410 laser confocal microscope; reconstructed views were created by using Zeiss LSM software, version 3.84. (A) Confocal reconstructed view of a series of optical sections of MACA/GFP (bottom). The line indicates plane used for reconstructing the _z_-plane section (top). (B) Confocal section of cell expressing 55GAG/GFP (bottom). The line indicates plane of optical z section displayed on top of the figure. (C) Confocal and transmission DIC image, GAGB/GFP represented by bright peripheral signal. (D) Confocal and transmission DIC image, MA/GFP. (E) Confocal and transmission DIC image, myr− GAGB/GFP. (F) Confocal section from a series of 1-μm optical sections corresponding to the plane of the coverslip, 55GAG/GFP.
FIG. 5
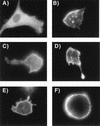
Epifluorescence microscopy of Gag-GFP fusion constructs from Fig. 1B. Acquisition of images was as for Fig. 3. (A) GAG377/GFP; (B) GAG391/GFP; (C) GAG405/GFP; (D) GAG411/GFP; (E) GAGB/GFP; (F) cell expressing GAGB/GFP which separated from the coverglass and assumed a round conformation.
FIG. 6
Quantitation of membrane binding of Gag-GFP fusion constructs. The protein content of membrane-enriched pellet and soluble fractions from differential sedimentation experiments was determined by fluorescence spectrophotometry using sample measurements compared to a standard curve generated from recombinant GFP. The percentage of protein present in the membrane-enriched pellet was calculated as protein in pellet/protein in soluble fraction plus protein in pellet. Results are means of three independent experiments for each construct, with error bars representing 1 standard deviation from the mean.
FIG. 7
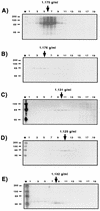
Determination of buoyant density of Gag-GFP particles. Following overnight labeling with [35S]cysteine-methionine, supernatants were collected and subjected to centrifugation through 20% sucrose pellets. Pelleted material was analyzed via equilibrium centrifugation on sucrose gradients as described in Materials and Methods. Gradient fractions were analyzed by SDS-PAGE and autoradiography following immunoprecipitation with pooled HIV patient sera. The data represent the bottom 20 fractions of a total of 30 collected fractions, with the bottom of the gradient to the left. The precise density of each gradient fraction was determined; densities of peak fractions are indicated above the autoradiogram. (A) 55GAG/GFP; (B) GAGB/GFP; (C) GAG377/GFP; (D) MACA/GFP; (E) GAGP/GFP. The positions of molecular mass markers are indicated at the left in kilodaltons.
FIG. 8
Comparison of buoyant densities of Gag-GFP constructs and HIV IIIB. Particles were prepared and labeled as described in Materials and Methods. Labeled supernatants from cells expressing GAGB/GFP, GAG391/GFP, MACA/GFP, and HIV-1 IIIB were separately centrifuged through a 20% cushion. The resuspended pellets were loaded onto the top of a single 20 to 60% sucrose gradient and centrifuged to equilibrium. Thirty fractions were collected; data for the bottom 20 fractions are presented. Gag proteins and Gag-GFP proteins in each fraction were immunoprecipitated with HIV patient sera and further analyzed by SDS-PAGE and autoradiography. Relative absorbance values were obtained by scanning the resulting autoradiogram on a flatbed scanner equipped for transparencies, and quantitation was performed with NIH Image software. (A) Plot of absorbance (y axis, relative values) for immunoprecipitated bands on the autoradiogram shown below. The x axis indicates fraction numbers, with the bottom of the gradient to the left. (B) Autoradiogram corresponding to the graphed results. Arrows point to the individual Gag-GFP fusion proteins. IIIB indicates the position of HIV-1 IIIB virions as demonstrated by radiolabeled and immunoprecipitated p24 (CA). The positions of molecular mass markers are indicated at the left in kilodaltons.
Similar articles
- Mapping and characterization of the N-terminal I domain of human immunodeficiency virus type 1 Pr55(Gag).
Sandefur S, Smith RM, Varthakavi V, Spearman P. Sandefur S, et al. J Virol. 2000 Aug;74(16):7238-49. doi: 10.1128/jvi.74.16.7238-7249.2000. J Virol. 2000. PMID: 10906178 Free PMC article. - Identification of human immunodeficiency virus type 1 Gag protein domains essential to membrane binding and particle assembly.
Spearman P, Wang JJ, Vander Heyden N, Ratner L. Spearman P, et al. J Virol. 1994 May;68(5):3232-42. doi: 10.1128/JVI.68.5.3232-3242.1994. J Virol. 1994. PMID: 8151785 Free PMC article. - Interaction and co-encapsidation of human immunodeficiency virus type 1 Gag and Vif recombinant proteins.
Huvent I, Hong SS, Fournier C, Gay B, Tournier J, Carrière C, Courcoul M, Vigne R, Spire B, Boulanger P. Huvent I, et al. J Gen Virol. 1998 May;79 ( Pt 5):1069-81. doi: 10.1099/0022-1317-79-5-1069. J Gen Virol. 1998. PMID: 9603321 - A novel fluorescence resonance energy transfer assay demonstrates that the human immunodeficiency virus type 1 Pr55Gag I domain mediates Gag-Gag interactions.
Derdowski A, Ding L, Spearman P. Derdowski A, et al. J Virol. 2004 Feb;78(3):1230-42. doi: 10.1128/jvi.78.3.1230-1242.2004. J Virol. 2004. PMID: 14722278 Free PMC article. - Membrane binding of human immunodeficiency virus type 1 matrix protein in vivo supports a conformational myristyl switch mechanism.
Spearman P, Horton R, Ratner L, Kuli-Zade I. Spearman P, et al. J Virol. 1997 Sep;71(9):6582-92. doi: 10.1128/JVI.71.9.6582-6592.1997. J Virol. 1997. PMID: 9261380 Free PMC article.
Cited by
- Effect of dimerizing domains and basic residues on in vitro and in vivo assembly of Mason-Pfizer monkey virus and human immunodeficiency virus.
Bohmová K, Hadravová R, Stokrová J, Tuma R, Ruml T, Pichová I, Rumlová M. Bohmová K, et al. J Virol. 2010 Feb;84(4):1977-88. doi: 10.1128/JVI.02022-09. Epub 2009 Dec 9. J Virol. 2010. PMID: 20007269 Free PMC article. - Human immunodeficiency virus type 1 matrix inhibits and confers cooperativity on gag precursor-membrane interactions.
Perez-Caballero D, Hatziioannou T, Martin-Serrano J, Bieniasz PD. Perez-Caballero D, et al. J Virol. 2004 Sep;78(17):9560-3. doi: 10.1128/JVI.78.17.9560-9563.2004. J Virol. 2004. PMID: 15308748 Free PMC article. - Advances in HIV-1 Assembly.
Lerner G, Weaver N, Anokhin B, Spearman P. Lerner G, et al. Viruses. 2022 Feb 26;14(3):478. doi: 10.3390/v14030478. Viruses. 2022. PMID: 35336885 Free PMC article. Review. - Tsg101 control of human immunodeficiency virus type 1 Gag trafficking and release.
Goff A, Ehrlich LS, Cohen SN, Carter CA. Goff A, et al. J Virol. 2003 Sep;77(17):9173-82. doi: 10.1128/jvi.77.17.9173-9182.2003. J Virol. 2003. PMID: 12915533 Free PMC article. - Ebola virus VP40-induced particle formation and association with the lipid bilayer.
Jasenosky LD, Neumann G, Lukashevich I, Kawaoka Y. Jasenosky LD, et al. J Virol. 2001 Jun;75(11):5205-14. doi: 10.1128/JVI.75.11.5205-5214.2001. J Virol. 2001. PMID: 11333902 Free PMC article.
References
- Barat C, Schatz O, Le Grice S, Darlix J L. Analysis of the interactions of HIV 1 replication primer tRNA(Lys,3) with nucleocapsid protein and reverse transcriptase. J Mol Biol. 1993;231:185–190. - PubMed
Publication types
MeSH terms
Substances
Grants and funding
- N01-AI-45210/AI/NIAID NIH HHS/United States
- R01 AI040338/AI/NIAID NIH HHS/United States
- R29 AI040338/AI/NIAID NIH HHS/United States
- P30 DK020593/DK/NIDDK NIH HHS/United States
- P30 CA068485/CA/NCI NIH HHS/United States
- AI40338-01A1/AI/NIAID NIH HHS/United States
LinkOut - more resources
Full Text Sources
Other Literature Sources

