Turnover of CD4+ and CD8+ T lymphocytes in HIV-1 infection as measured by Ki-67 antigen - PubMed (original) (raw)
Turnover of CD4+ and CD8+ T lymphocytes in HIV-1 infection as measured by Ki-67 antigen
N Sachsenberg et al. J Exp Med. 1998.
Abstract
We investigated CD4+ and CD8+ T cell turnover in both healthy and HIV-1-infected adults by measuring the nuclear antigen Ki-67 specific for cell proliferation. The mean growth fraction, corresponding to the expression of Ki-67, was 1.1% for CD4(+) T cells and 1.0% in CD8(+) T cells in healthy adults, and 6.5 and 4.3% in HIV-1-infected individuals, respectively. Analysis of CD45RA+ and CD45RO+ T cell subsets revealed a selective expansion of the CD8+ CD45RO+ subset in HIV-1-positive individuals. On the basis of the growth fraction, we derived the potential doubling time and the daily turnover of CD4+ and CD8+ T cells. In HIV-1-infected individuals, the mean potential doubling time of T cells was five times shorter than that of healthy adults. The mean daily turnover of CD4+ and CD8+ T cells in HIV-1-infected individuals was increased 2- and 6-fold, respectively, with more than 40-fold interindividual variation. In patients with <200 CD4+ counts, CD4+ turnover dropped markedly, whereas CD8+ turnover remained elevated. The large variations in CD4+ T cell turnover might be relevant to individual differences in disease progression.
Figures
Figure 1
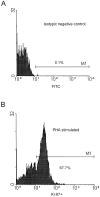
Flow cytometry analysis of CD3+CD4+ and CD3+ CD8+cells stained with Ki-67. (A) Isotypic negative control (FITC). (B) Expression of Ki-67 (percentage) in CD3+CD4+ T cells of a control blood donor after a 48-h in vitro stimulation with phytohemagglutinin. (C) Expression of Ki-67 (percentage) in CD3+CD4+ T cells of a control blood donor with 950 CD4+ T cells/mm3. (D) Expression of Ki-67 (percentage) in CD3+CD4+ T cells of a HIV-1–infected patient with 180 CD4+ T cells/mm3.
Figure 2
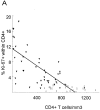
Percentage of Ki-67 expression in CD4+ and CD8+ T cells in HIV-1–infected patients (filled triangles) and healthy adults (open squares) versus absolute CD4+ and CD8+ counts. Regression lines are plotted for patient values only. (A) There is an inverse correlation between CD4+ T cell count and expression of Ki-67 in CD4+ T cells in HIV-1–infected patients (R = −0.64; P <0.001), but not in healthy adults (R = −0.18; P = 0.4). (B) HIV-1–infected patients have higher absolute CD8+ T cell counts and higher expression of Ki-67 in CD8+ T cells than do healthy adults. There is no correlation between percentage of Ki-67 and CD8+ count in HIV-1–infected patients (R = −0.12; P = 0.44) or in healthy adults (R = −0.03; P = 0.91).
Figure 3
Association between the percentage of Ki-67 expression, CD4+ T cell concentration and viremia. (A) Significant negative correlation between the percentage of Ki-67–positive CD8+ T cells and CD4+ T cell concentration (R = −0.44; P = 0.003). (B) Significant positive correlation between percentage of CD4+Ki-67+ and percent of CD8+Ki-67+ T cells (R = 0.62; P <0.001). (C) Positive correlation between percentage of Ki-67–positive CD4+ lymphocytes and the logarithm of the viral load (R = 0.44; P = 0.005).
Figure 4
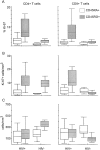
Higher expression of Ki-67 in CD45RO+ than in CD45RA+ subsets of both CD4+ and CD8+ T cells are found in HIV-1– infected individuals and in healthy adults. Results are depicted in box plot diagrams, where the box represents the 25th and 75th quartile and the line is the median value. Bars indicate 5th and 95th percentiles. (A) Higher percentage of Ki-67 in CD45RO+ than CD45RA+ subsets of CD4+ and CD8+ T cells in HIV-1–infected (Wilcoxon test, P = 0.008 and P <0.001, respectively) and healthy adults (P = 0.008 and P = 0.03, respectively). (B) Absolute numbers of proliferating cells of the CD45RA+ and CD45RO+ phenotype. There is no significant difference between HIV-1–infected individuals and healthy adults for the CD4+CD45RA+ (Mann-Whitney U test, P = 0.40), CD4+CD45RO+ (P = 0.22) and the CD8+CD45RA+ subset (P = 0.87), whereas Ki-67– positive CD8+CD45RO+ T cells are eightfold elevated in HIV-1–infected individuals (P <0.001). (C) Absolute numbers of CD4+CD45RA+, CD4+CD45RO+, CD8+CD45RA+, and CD8+ CD45RO+ T cells in HIV-1–infected and healthy adults. Significant differences between both groups were found in the CD4+CD45RO+ subset (P = 0.006) and the CD8+CD45RO+ subset (P = 0.007), but not in the CD4+CD45RA+ (P = 0.16) or the CD8+CD45RA+ subset (P = 0.31).
Figure 5
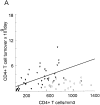
Daily T cell turnover (×109) versus T cell concentration in HIV-1–infected patients (filled triangles) and healthy adults (open squares). Regression lines are plotted for patient values only. (A) CD4+ T cells: there is a tendency to higher turnover in HIV-1–infected individuals (2.88 ± 2.31) than in healthy adults (1.54 ± 0.88). CD4+ T cell turnover is positively associated with CD4+ T cell concentration (R = 0.66, P <0.001) in HIV-1–infected individuals, but not in healthy adults (R = 0.29; P = 0.19). (B) CD8+ T cell turnover is increased up to 15-fold in HIV-1–infected individuals (4.49 ± 3.61) compared with values of healthy adults (0.73 ± 0.51). There is also a positive correlation between CD8+ T cell turnover and CD8+ T cell concentration in HIV-1–infected individuals (R = 0.68; P <0.001), but not in healthy adults (R = 0.38; P = 0.08).
Similar articles
- Distinct alterations in the distribution of CD45RO+ T-cell subsets in HIV-2 compared with HIV-1 infection.
Jaleco AC, Covas MJ, Pinto LA, Victorino RM. Jaleco AC, et al. AIDS. 1994 Dec;8(12):1663-8. doi: 10.1097/00002030-199412000-00004. AIDS. 1994. PMID: 7888114 - Increased numbers of primed activated CD8+CD38+CD45RO+ T cells predict the decline of CD4+ T cells in HIV-1-infected patients.
Bofill M, Mocroft A, Lipman M, Medina E, Borthwick NJ, Sabin CA, Timms A, Winter M, Baptista L, Johnson MA, Lee CA, Phillips AN, Janossy G. Bofill M, et al. AIDS. 1996 Jul;10(8):827-34. doi: 10.1097/00002030-199607000-00005. AIDS. 1996. PMID: 8828739 - Increased proliferation within T lymphocyte subsets of HIV-infected adolescents.
Starr SE, Sarr M, Campbell DE, Wilson CM, Douglas SD. Starr SE, et al. AIDS Res Hum Retroviruses. 2002 Nov 20;18(17):1301-10. doi: 10.1089/088922202320886343. AIDS Res Hum Retroviruses. 2002. PMID: 12487818 - Comprehensive Mass Cytometry Analysis of Cell Cycle, Activation, and Coinhibitory Receptors Expression in CD4 T Cells from Healthy and HIV-Infected Individuals.
Corneau A, Cosma A, Even S, Katlama C, Le Grand R, Frachet V, Blanc C, Autran B. Corneau A, et al. Cytometry B Clin Cytom. 2017 Jan;92(1):21-32. doi: 10.1002/cyto.b.21502. Cytometry B Clin Cytom. 2017. PMID: 27997758 Review.
Cited by
- Cytokine expression, natural killer cell activation, and phenotypic changes in lymphoid cells from rhesus macaques during acute infection with pathogenic simian immunodeficiency virus.
Giavedoni LD, Velasquillo MC, Parodi LM, Hubbard GB, Hodara VL. Giavedoni LD, et al. J Virol. 2000 Feb;74(4):1648-57. doi: 10.1128/jvi.74.4.1648-1657.2000. J Virol. 2000. PMID: 10644334 Free PMC article. - Factors influencing T-cell turnover in HIV-1-seropositive patients.
McCune JM, Hanley MB, Cesar D, Halvorsen R, Hoh R, Schmidt D, Wieder E, Deeks S, Siler S, Neese R, Hellerstein M. McCune JM, et al. J Clin Invest. 2000 Mar;105(5):R1-8. doi: 10.1172/JCI8647. J Clin Invest. 2000. PMID: 10712441 Free PMC article. - Long-term kinetics of T cell production in HIV-infected subjects treated with highly active antiretroviral therapy.
Fleury S, Rizzardi GP, Chapuis A, Tambussi G, Knabenhans C, Simeoni E, Meuwly JY, Corpataux JM, Lazzarin A, Miedema F, Pantaleo G. Fleury S, et al. Proc Natl Acad Sci U S A. 2000 May 9;97(10):5393-8. doi: 10.1073/pnas.97.10.5393. Proc Natl Acad Sci U S A. 2000. PMID: 10805798 Free PMC article. Clinical Trial. - Divergent Expression of CXCR5 and CCR5 on CD4+ T Cells and the Paradoxical Accumulation of T Follicular Helper Cells during HIV Infection.
Zaunders J, Xu Y, Kent SJ, Koelsch KK, Kelleher AD. Zaunders J, et al. Front Immunol. 2017 May 12;8:495. doi: 10.3389/fimmu.2017.00495. eCollection 2017. Front Immunol. 2017. PMID: 28553284 Free PMC article. Review. - Diminished production of monocyte proinflammatory cytokines during human immunodeficiency virus viremia is mediated by type I interferons.
Tilton JC, Johnson AJ, Luskin MR, Manion MM, Yang J, Adelsberger JW, Lempicki RA, Hallahan CW, McLaughlin M, Mican JM, Metcalf JA, Iyasere C, Connors M. Tilton JC, et al. J Virol. 2006 Dec;80(23):11486-97. doi: 10.1128/JVI.00324-06. Epub 2006 Sep 27. J Virol. 2006. PMID: 17005663 Free PMC article.
References
- Fauci AS, Schnittman SM, Poli G, Koening S, Pantaleo G. Immunopathogenic mechanisms in human immunodeficiency virus (HIV) infection. Ann Intern Med. 1991;114:678–693. - PubMed
- Margolick JB. Changes in T and non-T lymphocyte subsets following seroconversion to HIV-1: stable CD3+and declining CD3 populations suggest regulatory responses linked to loss of CD4 lymphocytes. J Acquir Immune Defic Syndr. 1993;6:153–161. - PubMed
- Margolick JB, Munoz A, Donnenberg AD, Park LP, Galai N, Giorgi JV, O'Gorman MRG, Ferbas J. Failure of T-cell homeostatis preceding AIDS in HIV-1 infection. Nat Med. 1995;1:1674–1680. - PubMed
- Piatak M, Saag MS, Yang LC, Clark SJ, Kappes JC, Luk K-C, Hahn BH, Shaw GM, Lifson JD. High levels of HIV-1 in plasma during all stages of infection determined by competitive PCR. Science. 1993;259:1749–1754. - PubMed
- Pantaleo G, Graziosi C, Fauci AS. New concepts in the immunopathogenesis of human immunodeficiency virus infection. N Engl J Med. 1993;328:327–335. - PubMed
Publication types
MeSH terms
Substances
LinkOut - more resources
Full Text Sources
Other Literature Sources
Medical
Research Materials


