Failure of megakaryopoiesis and arrested erythropoiesis in mice lacking the GATA-1 transcriptional cofactor FOG - PubMed (original) (raw)
Failure of megakaryopoiesis and arrested erythropoiesis in mice lacking the GATA-1 transcriptional cofactor FOG
A P Tsang et al. Genes Dev. 1998.
Abstract
GATA transcription factors are required for the differentiation of diverse cell types in several species. Recent evidence suggests that their biologic activities may be modulated through interaction with multitype zinc finger proteins, such as Friend of GATA-1 (FOG) and U-shaped (Ush). In cell culture, FOG cooperates with the hematopoietic transcription factor GATA-1 to promote erythroid and megakaryocytic differentiation. We show here that mice lacking FOG die during mid-embryonic development with severe anemia. FOG-/- erythroid cells display a marked, but partial, blockage of maturation, reminiscent of GATA-1- erythroid precursors. In contrast to GATA-1 deficiency, however, megakaryocytes fail to develop in the absence of FOG. Although the FOG-/- erythroid phenotype supports the proposed role of FOG as a GATA-1 cofactor in vivo, the latter finding points to a pivotal, GATA-1-independent requirement for FOG in megakaryocyte development from the bipotential erythroid/megakaryocytic progenitor. We speculate that FOG and other FOG-like proteins serve as complex cofactors that act through both GATA-dependent and GATA-independent mechanisms.
Figures
Figure 1
Targeted disruption of the mouse FOG gene. (A) Partial restriction map of the mouse FOG locus (top) and structures of the two FOG targeting vectors (middle and bottom). The first targeting construct (pPNT FOG) contains the HSV–tk and neomycin resistance (_neo_r) genes, both under the control of the mouse phosphoglycerate kinase (PGK) promoter; the second construct (pTKLNCL FOG) contains HSV–tk and _neo_r genes, as well as the cytosine deaminase gene. Homologous recombination results in disruption of the coding sequence of FOG and removal of exons encoding zinc fingers (z) 1–z7 or z1–z4 of FOG, respectively. FOG-coding exons are depicted as empty boxes; the numbers (1–9) below these boxes denote the positions of the nine zinc fingers of the FOG protein. Small half-arrows above FOG exons indicate positions of RT–PCR primers. The flanking probes used for Southern blot analysis are shown as black bars. Thin black boxes in pTKLNCL FOG represent loxP sites. (B) _Bam_HI; (Bg) _Bgl_II; (Bs) _Bst_EII; (E) _Eco_RI; (Hd) _Hin_dIII; (K) _Kpn_I; (N) _Not_I; (X) _Xba_I. (B) Southern blot analysis of G418- and Gancyclovir-resistant ES cell clones. Note that one targeted ES clone was derived from each construct and used to generate germ-line transmitting chimeras. (wt) wild-type allele; (mut) mutant allele. (C) Southern blot analysis of E10.5 embryos resulting from an intercross of FOG+/− mice, demonstrating the presence of all expected genotypes, including homozygous mutants. (D) RT–PCR analysis of total RNA from peripheral blood of viable E11.5 embryos. RNA was amplified with FOG-specific primers that bracket the 5′ position of the _neo_R cassette insertion (see A). As a control, RT–PCR was also performed for HPRT RNA.
Figure 2
Phenotypic comparison of wild-type and FOG−/− embryos at E11.5. (A,B) Wild-type and FOG−/− E11.5 embryos with intact visceral yolk sacs (YS). (C,D) Wild-type and FOG−/− E11.5 embryos dissected free of the yolk sacs. Mutant embryos appear morphologically normal, except for the pale, slightly orange coloring of their fetal livers and circulating blood.
Figure 3
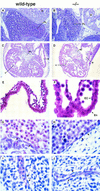
Histological analysis of wild-type and FOG−/− embryos. (A,B) Hematoxylin and eosin (H &E)-stained sagittal sections of wild-type and FOG−/− E11.5 embryos, revealing dark-stained hematopoietic elements within vessels and sinusoids of the fetal liver. Note that at this early stage of fetal liver hematopoiesis only nucleated definitive erythoblasts are observable in wild-type and mutant fetal livers. (FL) fetal liver; (H) heart. Original magnification, 200×. (C,D) H&E-stained transverse sections through the fetal hearts of wild-type and FOG−/− E11.5 embryos. Although mutant hearts are smaller than those of wild-type embryos, cardiac development does not appear to be impaired. (a) atrium; (v) ventricle; (ec) endocardial cushion. Original magnification, 100×. (E,F) H&E-stained sections of yolk sacs from wild-type and FOG−/− E10.5 embryos. No obvious defects in the vasculature of mutant yolk sacs are apparent by histological analysis. Note the presence of primitive blood cells in sections of mutant yolk sacs. Although not evident here because of H&E overstaining, these mutant cells are morphologically abnormal (see Fig. 4A). (En) extraembryonic endoderm; (EC) endothelial cell. Original magnifications, 400× and 1000×, respectively. (G–J) H&E-stained sagittal sections showing the presence of endothelial cell-lined aortas (G,H) and intersomitic vessels (I,J) in both wild-type and mutant embryos. Note the abnormal morphology of mutant blood cells (asterisks). Arrows indicate endothelial cells. Original magnification, 1000×.
Figure 4
Defective primitive erythropoiesis in mice lacking FOG. (A) May–Grunwald–Giemsa staining of blood cells from wild-type and FOG−/− yolk sacs. Proerythroblast-like cells (arrows), characterized by large nuclei and basophilic cytoplasm, as well as large, megaloblastic cells are abundant in the peripheral blood of mutant embryos. Original magnification, 1000×. (B) RNase protection analysis of embryonic (ζ, ε, βH1) and adult (α, βmaj) globin transcripts in E11.5 peripheral blood from heterozygous (+/−) and homozygous mutant (−/−) embryos. To establish relative amounts of RNAs, each sample was simultaneously hybridized with an internal standard probe (mouse β-actin RNA or human 28S rRNA).
Figure 5
Severe impairment of in vitro erythroid differentiation in the absence of FOG. (A–D) Hematopoietic progenitor colony assays from yolk sacs and fetal livers of wild-type and mutant (−/−) embryos. (A,B) May–Grunwald–Giemsa staining of cells from wild-type and mutant CFU-Es. Colonies were grown in the presence of Epo for 2–3 days. (C,D) May–Grunwald–Giemsa staining of cells from wild-type and mutant BFU-Es. Colonies were grown in the presence of Epo-KL for 4–6 days. Mutant colonies contained proerythroblasts (arrow), cells with fragmented nuclei (arrowhead), and other morphologically abnormal cell types such as mast-like cells (asterisk).
Figure 6
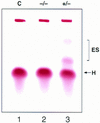
Contribution of ES-derived cells to mature red blood cells of chimeras. Hemoglobin was analyzed in the peripheral blood of chimeras made with FOG+/− and FOG−/− ES cells. The Hbbs haplotype (H) is specific for host blastocysts of strain C57BL/6; Hbbd (ES) is specific for ES cells of strain 129/Sv. The figure shown is representative for four chimeras generated from two independently targeted FOG−/− ES cell clones. (C) control.
Figure 7
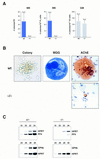
Absolute requirement for FOG in early megakaryopoiesis in vitro. Yolk sac and fetal liver cells from wild-type and homozygous mutant (−/−) embryos were assayed in semisolid medium for megakaryocytic colonies. (A) Number of megakaryocytic (MK) and granulocyte-macrophage (GM) colonies observed after 6 days of cultivation. Numbers (N) at the top of each error bar indicate the number of embryos analyzed. Error bars represent SEM. (YS) yolk sac; (FL) fetal liver. (B) May–Grunwald–Giemsa and AChE staining of cells from wild-type and mutant (−/−) colonies. Wild-type megakaryocytes were readily identified by their large size, multilobed nuclei, granular cytoplasm, and AChE positivity, which appears as orange/brown cytoplasmic staining. Small, AChE-positive cells were very rarely observed in mutant cultures. Original magnification, 630×. (C) RT–PCR analysis of PF4 and GPIIb mRNAs from hematopoietic colonies cultured in the presence of Tpo. RT–PCR amplification of HPRT transcripts served as an internal control for quantitation. Samples were amplified for six cycles in the presence of HPRT primers, before addition of PF4 primers.
Figure 8
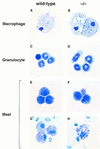
Morphological assessment of myeloid and mast cells lacking FOG. Yolk sac and fetal liver cells from wild-type and mutant (−/−) embryos were assayed in semisolid medium for granulocyte–macrophage or mast colonies. Macrophages (A,B) and granulocytes (C,D) from wild-type and mutant myeloid colonies were morphologically indistinguishable. Cells with mast cell morphology (E,F) and toluidine blue-positive granules (G,H) were also identified in wild-type and mutant cultures. Original magnifications, 630× (macrophages), 1000× (granulocytes and mast cells).
Figure 9
In vitro differentiation of FOG−/− ES cells. (A–G) May–Grunwald–Giemsa staining of cells from primitive erythroid (EryP) colonies (A,B), definitive erythroid (EryD) colonies (C,D), megakaryocyte colonies (E), and macrophage colonies (F,G). Mutant EryP and EryD cells display a prominent defect in maturation, as evidenced by their large size and uncondensed nuclei. No megakaryocytic cells were obtained upon replating mutant embryoid bodies in the presence of thrombopoietin. Wild-type and mutant macrophages were morphologically indistinguishable. Original magnifications, 1000× (erythroid and megakaryocytic cells), 630× (macrophages).
Figure 10
Developmental blocks imposed by loss of FOG or GATA-1. The consequences of FOG or GATA-1 deficiency for erythroid development are remarkably similar, strengthening the notion that the two proteins act in concert to drive erythroid-specific differentiation. In contrast to GATA-1 deficiency, loss of FOG leads to the specific ablation of the megakaryocytic lineage at a very early stage, pointing to a pivotal, GATA-1-independent role for FOG in early megakaryopoiesis.
Similar articles
- FOG, a multitype zinc finger protein, acts as a cofactor for transcription factor GATA-1 in erythroid and megakaryocytic differentiation.
Tsang AP, Visvader JE, Turner CA, Fujiwara Y, Yu C, Weiss MJ, Crossley M, Orkin SH. Tsang AP, et al. Cell. 1997 Jul 11;90(1):109-19. doi: 10.1016/s0092-8674(00)80318-9. Cell. 1997. PMID: 9230307 - GATA-factor dependence of the multitype zinc-finger protein FOG-1 for its essential role in megakaryopoiesis.
Chang AN, Cantor AB, Fujiwara Y, Lodish MB, Droho S, Crispino JD, Orkin SH. Chang AN, et al. Proc Natl Acad Sci U S A. 2002 Jul 9;99(14):9237-42. doi: 10.1073/pnas.142302099. Epub 2002 Jun 20. Proc Natl Acad Sci U S A. 2002. PMID: 12077323 Free PMC article. - Differentiation status dependent function of FOG-1.
Tanaka M, Zheng J, Kitajima K, Kita K, Yoshikawa H, Nakano T. Tanaka M, et al. Genes Cells. 2004 Dec;9(12):1213-26. doi: 10.1111/j.1365-2443.2004.00796.x. Genes Cells. 2004. PMID: 15569153 - Coregulation of GATA factors by the Friend of GATA (FOG) family of multitype zinc finger proteins.
Cantor AB, Orkin SH. Cantor AB, et al. Semin Cell Dev Biol. 2005 Feb;16(1):117-28. doi: 10.1016/j.semcdb.2004.10.006. Epub 2004 Dec 15. Semin Cell Dev Biol. 2005. PMID: 15659346 Review. - Transcription factor GATA-1 in megakaryocyte development.
Orkin SH, Shivdasani RA, Fujiwara Y, McDevitt MA. Orkin SH, et al. Stem Cells. 1998;16 Suppl 2:79-83. doi: 10.1002/stem.5530160710. Stem Cells. 1998. PMID: 11012179 Review.
Cited by
- GATA1 in Normal and Pathologic Megakaryopoiesis and Platelet Development.
Takasaki K, Chou ST. Takasaki K, et al. Adv Exp Med Biol. 2024;1459:261-287. doi: 10.1007/978-3-031-62731-6_12. Adv Exp Med Biol. 2024. PMID: 39017848 Review. - PI3K/HSCB axis facilitates FOG1 nuclear translocation to promote erythropoiesis and megakaryopoiesis.
Liu G, Hou Y, Jin X, Zhang Y, Sun C, Huang C, Ren Y, Gao J, Wang X, Jiang X. Liu G, et al. Elife. 2024 May 17;13:RP95815. doi: 10.7554/eLife.95815. Elife. 2024. PMID: 38757931 Free PMC article. - Unfriendly protein of GATA1 and mechanisms of bone marrow failure.
Dror Y. Dror Y. Haematologica. 2024 Sep 1;109(9):2761-2763. doi: 10.3324/haematol.2024.285041. Haematologica. 2024. PMID: 38618686 Free PMC article. No abstract available. - Enhancement of PRMT6 binding to a novel germline GATA1 mutation associated with congenital anemia.
Lu Y, Zhu Q, Wang Y, Luo M, Huang J, Liang Q, Huang L, Ouyang J, Li C, Tang N, Li Y, Kang T, Song Y, Xu X, Ye L, Zheng G, Chen C, Zhu C. Lu Y, et al. Haematologica. 2024 Sep 1;109(9):2955-2968. doi: 10.3324/haematol.2023.284183. Haematologica. 2024. PMID: 38385251 Free PMC article. - Dynamics of Chromatin Accessibility During Hematopoietic Stem Cell Differentiation Into Progressively Lineage-Committed Progeny.
Martin EW, Rodriguez Y Baena A, Reggiardo RE, Worthington AK, Mattingly CS, Poscablo DM, Krietsch J, McManus MT, Carpenter S, Kim DH, Forsberg EC. Martin EW, et al. Stem Cells. 2023 May 15;41(5):520-539. doi: 10.1093/stmcls/sxad022. Stem Cells. 2023. PMID: 36945732 Free PMC article.
References
- Andrews NC, Erdjument-Bromage H, Davidson MB, Tempst P, Orkin SH. Erythroid transcription factor NF-E2 is a haematopoietic-specific basic-leucine zipper protein. Nature. 1993;362:722–728. - PubMed
- Baron MH, Maniatis T. Rapid reprogramming of globin gene expression in transient heterokaryons. Cell. 1986;46:591–602. - PubMed
- Chomczynski P, Sacchi N. Single-step method of RNA isolation by acid guanidinium thiocyanate-phenol-chloroform extraction. Anal Biochem. 1987;162:156–159. - PubMed
Publication types
MeSH terms
Substances
LinkOut - more resources
Full Text Sources
Molecular Biology Databases


