A role for Fas in negative selection of thymocytes in vivo - PubMed (original) (raw)
A role for Fas in negative selection of thymocytes in vivo
H Kishimoto et al. J Exp Med. 1998.
Abstract
To seek information on the role of Fas in negative selection, we examined subsets of thymocytes from normal neonatal mice versus Fas-deficient lpr/lpr mice injected with graded doses of antigen. In normal mice, injection of 1-100 microg of staphylococcal enterotoxin B (SEB) induced clonal elimination of SEB-reactive Vbeta8+ cells at the level of the semi-mature population of HSAhi CD4+ 8- cells found in the thymic medulla; deletion of CD4+ 8+ cells was minimal. SEB injection also caused marked elimination of Vbeta8+ HSAhi CD4+ 8- thymocytes in lpr/lpr mice. Paradoxically, however, elimination of these cells in lpr/lpr mice was induced by low-to-moderate doses of SEB (</=1 microg) but not by high doses (100 microg). Similar findings applied when T cell receptor transgenic mice were injected with specific peptide. These findings suggest that clonal elimination of semi-mature medullary T cells is Fas independent at low doses of antigen but Fas dependent at high doses. Previous reports documenting that negative selection is not obviously impaired in lpr/lpr mice could thus reflect that the antigens studied were expressed at only a low level.
Figures
Figure 1
SEB-mediated negative selection of Vβ8+ CD4+ 8− thymocytes in adult and neonatal C3H mice. Adult (10-wk-old) or newborn (4-d-old) mice were injected intraperitoneally with PBS or the indicated amount of SEB, and thymuses were harvested 2 d after injection; thymocyte suspensions were four-color stained for CD4, CD8, HSA, and Vβ8 or Vβ6 and were FACS® analyzed as described in Materials and Methods. The following FACS® plots are shown: CD4 versus CD8 on all thymocytes (left); Vβ8 and Vβ6 expression on gated CD4+ 8− cells (middle); and HSA expression on gated Vβ8+ CD4+ 8− and Vβ6+ CD4+ 8− cells (right). The average number of total thymocytes recovered from each mouse is shown at the left. The FACS® plots refer to thymocytes from individual mice and are representative of data from 2 to 3 mice per group.
Figure 2
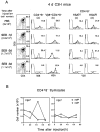
The kinetics of negative selection of Vβ8+ CD4+ 8− cells induced by injection of SEB. Neonatal (4-d-old) C3H mice were injected intraperitoneally with SEB (25 μg) at 1, 2, or 3 d before mice were killed. Thymocytes from SEB-injected mice were then stained with mAbs specific for Vβ8 or Vβ6, CD4, CD8, and HSA. (A) Left: Total cell numbers (mean data from 5–8 mice per group) and CD4 versus CD8 expression (data from one representative mouse). Middle and right: (a) Vβ8 expression on gated CD4+ 8− cells; (b) HSA expression on gated Vβ8+ CD4+ 8− cells; (c) Vβ8 expression on gated HSAhi CD4+ 8− cells; (d) Vβ8 expression on gated HSAlo CD4+ 8− cells. (B) Total numbers of CD4+ 8− thymocyte subsets per mouse recovered from SEB-injected mice at the time points shown. Total numbers of Vβ8+ HSAhi versus Vβ8+ HSAlo cells (left) and Vβ6+ HSAhi versus Vβ6+ HSAlo cells (right) are shown. The data represent the mean values obtained from two different experiments involving 5–8 mice per group.
Figure 3
SEB-induced negative selection of CD4+ 8hi, CD4+ 8lo, and CD4+ 8− thymocytes. The data show Vβ8 (bottom left) and Vβ6 (bottom right) expression on gated CD4+ 8hi, CD4+ 8lo, and CD4+ 8− thymocytes from neonatal C3H mice injected with PBS or SEB 1 or 2 d earlier. The FACS® gates used to define CD4/CD8 expression are shown at the top. For Vβ expression, the percentages shown refer to Vβlo and Vβhi cells for CD4+ 8hi cells and to Vβhi cells for CD4+ 8lo and CD4+ 8− cells. The data illustrated are from a single representative from each group; the numbers in parentheses refer to the mean values obtained from three mice per group.
Figure 4
SEB-induced negative selection of CD4+ 8− thymocytes in vitro. Purified HSAhi or HSAlo CD4+ 8− thymocytes from neonatal C3H mice were cultured in vitro for 20 h with or without SEB (10 μg/ml) in the presence of splenic APCs. After culture, cells were surface stained for HSA, Vβ8, and Vβ6 expression; after washing, cells were fixed and stained by TUNEL for apoptotic cells. (A) Proportion of TUNEL+ (apoptotic) cells in gated Vβ8+ cells (left) and Vβ6+ cells (right) in HSAhi versus HSAlo subsets; TUNEL staining is plotted against forward scatter (FSC). (B) Representation of the data shown in A after subtraction of the background values for apoptosis found for cells cultured with APCs without SEB. (C) HSA expression on viable (TUNEL−) Vβ8+ cells (left) and Vβ6+ cells (right) after culture with APCs ± SEB. (D) Proportion of Vβ8+ cells in the viable (TUNEL−) subsets of HSAhi versus HSAlo cells after culture with APCs ± SEB. The data shown are representative of three separate experiments.
Figure 5
Susceptibility of HSAhi versus HSAlo subsets of CD4+ 8− thymocytes to apoptosis in vitro after exposure to SEB in vivo. HSAhi versus HSAlo CD4+ 8− thymocytes from neonatal C3H mice injected with PBS or SEB (50 μg/mouse) 28 h earlier were purified by panning and mAb + C (see Materials and Methods). The purified cells were cultured in normal tissue culture medium in vitro for 20 h at 37°C without SEB or APCs and then stained for Vβ8 or Vβ6 followed by TUNEL staining after fixation. Levels of apoptosis found for comparable cultured populations of thymocytes prepared from uninjected control mice have been subtracted from the data shown. The data represent the mean values obtained from three separate experiments.
Figure 6
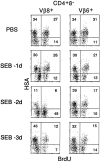
BrdU incorporation by CD4+ 8− thymocyte subsets after SEB injection. Neonatal C3H mice were injected with PBS or SEB and killed 1, 2, or 3 d later (1 d later for PBS); starting at 20 h before death, the mice received two intraperitoneal injections of BrdU 8 h apart (−20 h and −12 h). Purified CD8− cells (cells treated with anti-CD8 mAb + C) were surface stained for Vβ8 or Vβ6, CD4, and CD8, then fixed and stained for BrdU. The data show BrdU versus HSA expression on gated Vβ8+ CD4+ 8− (left) and Vβ6+ CD4+ 8− (right) cells. The data are representative of three separate experiments.
Figure 7
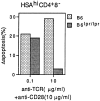
Relative sensitivity of normal B6 and B6_lpr/lpr_ HSAhi CD4+ 8− thymocytes to SEB-induced negative selection in vitro. Purified HSAhi CD4+ 8− thymocytes prepared from adult (6-wk-old) mice were cultured in vitro for 20 h in wells coated with a fixed concentration of anti-CD28 mAb (10 μg/ml) plus a low or high concentration of anti-TCR mAb (0.1 μg/ml or 10 μg/ml). After culture, cells were stained for TUNEL to detect apoptotic cells. The data show percentage of apoptotic (TUNEL+) cells after subtraction of the background levels for cells cultured alone. The data represent the mean of four separate experiments.
Figure 8
Negative selection of HSAhi CD4+ 8− thymocytes from C3H versus MRL_lpr/lpr_ mice injected with graded doses of SEB or anti-TCR mAb. Thymocytes were prepared at 2 d after intraperitoneal injection of various doses of SEB or anti-TCR mAb and stained. (A) Neonatal (4-d-old) C3H mice injected with SEB. The data represent mean values from four separate experiments with two to three mice per group. (B) Adult (7-wk-old) mice injected with SEB. The data represent mean values from four separate experiments with two mice/group. (C) Neonatal (4-d-old) mice injected with anti-TCR mAb. The data show total numbers of CD4+ 8− subsets per thymus. The data represent mean values from two separate experiments with two mice per group.
Figure 9
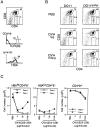
Negative selection of HSAhi CD4+ 8− thymocytes from neonatal (4-d-old) Fas+/− versus Fas−/− D011 TCR transgenic mice injected with graded doses of ova 323–339 peptide. Thymocytes were prepared at 2 d after intraperitoneal injection of peptide or PBS as a control and stained for CD4, CD8, HSA, and idiotypic (Id) TCR expression. (A) Phenotype of normal (uninjected) Fas+/− D011 thymocytes showing CD4 versus CD8 expression (top), TCR expression on CD4+ 8− cells detected by the anticlonotypic mAb KJ1-26 (middle), and HSA expression on Id+ CD4+ 8− cells (bottom); Id and HSA expression on normal nontransgenic CD4+ 8− thymocytes is shown in the heavy lines. (B) Representative data on CD4 versus CD8 expression on thymocytes from Fas+/− versus Fas−/− D011 mice injected with PBS and 1 or 100 μg of ova peptide. (C) Total numbers of HSAhi CD4+ 8−, HSAlo CD4+ 8−, and CD4+ 8+ thymocytes/mouse from Fas+/− versus Fas−/− D011 mice injected with various doses of ova peptide; the data represent mean values from four separate experiments with one to two mice per group.
Similar articles
- Delayed kinetics of T lymphocyte anergy and deletion in lpr mice.
Mixter PF, Russell JQ, Budd RC. Mixter PF, et al. J Autoimmun. 1994 Dec;7(6):697-710. doi: 10.1006/jaut.1994.1055. J Autoimmun. 1994. PMID: 7534079 - Expression and function of mouse Fas antigen on immature and mature T cells.
Nishimura Y, Ishii A, Kobayashi Y, Yamasaki Y, Yonehara S. Nishimura Y, et al. J Immunol. 1995 May 1;154(9):4395-403. J Immunol. 1995. PMID: 7536770 - Apoptosis defects analyzed in TcR transgenic and fas transgenic lpr mice.
Mountz JD, Zhou T, Bluethmann H, Wu J, Edwards CK 3rd. Mountz JD, et al. Int Rev Immunol. 1994;11(4):321-42. doi: 10.3109/08830189409051178. Int Rev Immunol. 1994. PMID: 7528763 Review. - Defective clonal deletion and anergy induction in TCR transgenic lpr/lpr mice.
Mountz JD, Bluethmann H, Zhou T, Wu J. Mountz JD, et al. Semin Immunol. 1994 Feb;6(1):27-37. doi: 10.1006/smim.1994.1005. Semin Immunol. 1994. PMID: 8167304 Review.
Cited by
- Reflections on CD8 T-cell activation and memory.
Masopust D, Ahmed R. Masopust D, et al. Immunol Res. 2004;29(1-3):151-60. doi: 10.1385/IR:29:1-3:151. Immunol Res. 2004. PMID: 15181278 Review. - Fas (CD95/APO-1) limits the expansion of T lymphocytes in an environment of limited T-cell antigen receptor/MHC contacts.
Fortner KA, Lees RK, MacDonald HR, Budd RC. Fortner KA, et al. Int Immunol. 2011 Feb;23(2):75-88. doi: 10.1093/intimm/dxq466. Epub 2011 Jan 25. Int Immunol. 2011. PMID: 21266499 Free PMC article. - Negative selection of semimature CD4(+)8(-)HSA+ thymocytes requires the BH3-only protein Bim but is independent of death receptor signaling.
Villunger A, Marsden VS, Zhan Y, Erlacher M, Lew AM, Bouillet P, Berzins S, Godfrey DI, Heath WR, Strasser A. Villunger A, et al. Proc Natl Acad Sci U S A. 2004 May 4;101(18):7052-7. doi: 10.1073/pnas.0305757101. Epub 2004 Apr 26. Proc Natl Acad Sci U S A. 2004. PMID: 15118096 Free PMC article. - Thymocyte development in the absence of matrix metalloproteinase-9/gelatinase B.
Gounko NV, Martens E, Opdenakker G, Rybakin V. Gounko NV, et al. Sci Rep. 2016 Jul 19;6:29852. doi: 10.1038/srep29852. Sci Rep. 2016. PMID: 27432536 Free PMC article. - Mutation in fas ligand impairs maturation of thymocytes bearing moderate affinity T cell receptors.
Boursalian TE, Fink PJ. Boursalian TE, et al. J Exp Med. 2003 Jul 21;198(2):349-60. doi: 10.1084/jem.20030220. Epub 2003 Jul 14. J Exp Med. 2003. PMID: 12860933 Free PMC article.
References
- Kappler JW, Roehm N, Marrack P. T cell tolerance by clonal elimination in the thymus. Cell. 1987;49:273–280. - PubMed
- Nossal GJV. Negative selection of lymphocytes. Cell. 1994;76:229–239. - PubMed
- Sprent J, Webb SR. Intrathymic and extrathymic clonal deletion of T cells. Curr Opin Immunol. 1995;7:196–205. - PubMed
- Robey E, Fowlkes BJ. Selective events in T cell development. Annu Rev Immunol. 1994;12:675–705. - PubMed
- Brunner T, Mogil RJ, LaFace D, Yoo NJ, Mahboubi A, Echeverri F, Martin SJ, Force WR, Lynch DH, Ware CF, Green DR. Cell-autonomous Fas (CD95)/ Fas-ligand interaction mediates activation-induced apoptosis in T-cell hybridomas. Nature. 1995;373:441–444. - PubMed
Publication types
MeSH terms
Substances
Grants and funding
- P01 AG001743/AG/NIA NIH HHS/United States
- R37 CA038355/CA/NCI NIH HHS/United States
- CA25803/CA/NCI NIH HHS/United States
- CA38355/CA/NCI NIH HHS/United States
- AI21487/AI/NIAID NIH HHS/United States
LinkOut - more resources
Full Text Sources
Molecular Biology Databases
Research Materials
Miscellaneous


