Peroxisome degradation by microautophagy in Pichia pastoris: identification of specific steps and morphological intermediates - PubMed (original) (raw)
Peroxisome degradation by microautophagy in Pichia pastoris: identification of specific steps and morphological intermediates
Y Sakai et al. J Cell Biol. 1998.
Abstract
We used the dye N-(3-triethylammoniumpropyl)-4-(p-diethylaminophenylhexatrienyl ) pyridinium dibromide (FM4-64) and a fusion protein, consisting of the green fluorescent protein appended to the peroxisomal targeting signal, Ser-Lys-Leu (SKL), to label the vacuolar membrane and the peroxisomal matrix, respectively, in living Pichia pastoris cells and followed by fluorescence microscopy the morphological and kinetic intermediates in the vacuolar degradation of peroxisomes by microautophagy and macroautophagy. Structures corresponding to the intermediates were also identified by electron microscopy. The kinetics of appearance and disappearance of these intermediates is consistent with a precursor-product relationship between intermediates, which form the basis of a model for microautophagy. Inhibitors affecting different steps of microautophagy did not impair peroxisome delivery to the vacuole via macroautophagy, although inhibition of vacuolar proteases affected the final vacuolar degradation of green fluorescent protein (S65T mutant version [GFP])-SKL via both autophagic pathways. P. pastoris mutants defective in peroxisome microautophagy (pag mutants) were isolated and characterized for the presence or absence of the intermediates. These mutants, comprising 6 complementation groups, support the model for microautophagy. Our studies indicate that the microautophagic degradation of peroxisomes proceeds via specific intermediates, whose generation and/or processing is controlled by PAG gene products, and shed light on the poorly understood phenomenon of peroxisome homeostasis.
Figures
Figure 1
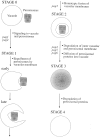
Schematic model of microautophagic degradation of peroxisomes in P. pastoris. Microautophagic degradation of peroxisomes is dissected into four stages (see text) depending on the morphology and the appearance and disappearance of intermediates in the process. Mutations in specific PAG genes terminate this process at the stages indicated.
Figure 2
Morphological changes of vacuolar membranes and peroxisomal GFP-SKL during microautophagic degradation of peroxisomes after glucose adaptation. Double fluorescence of methanol-grown cells of P. pastoris cells at various times after the switch to glucose medium. (a) 0 h, (b) 30 min, (c) 2 h.
Figure 3
Fluorescence and electron microscope images showing various stages during microautophagic degradation of peroxisomes. The three panels in each figure are as follows (a–e, left) FM4-64; (center) GFP-SKL; (right) superimposed FM4-64 and GFP-SKL signals. (a, f) stage 0; (b, g) early stage 1; (c, h) late stage 1; (d, i) stage 2; (e) stage 3. (d, arrowhead) During the capture of these fluorescence images, this peroxisome-containing vesicle had just pinched off from the outer vacuolar membrane. Therefore, the FM4-64–stained vesicle membrane and GFP-SKL could not be superimposed in this picture.
Figure 4
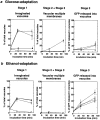
Kinetics of morphological changes in vacuoles and peroxisomal GFP-SKL during microautophagic degradation of P. pastoris peroxisomes in glucose adaptation. At least 350 vacuoles or 350 clusters of peroxisomes were counted for each time point. Cells were counted in three randomly selected fields, and standard deviations are shown as vertical bars.
Figure 5
Macroautophagic degradation of peroxisomes after transfer of methanol-grown P. pastoris cells to ethanol medium. (a–e) Electron micrographs of intermediates seen during macroautophagy. (a) After 1 h of ethanol adaptation, peroxisomes (P) were often surrounded by autophagosomal membranes, higher magnifications of which are in d and e. (b) After 1 h of ethanol adaptation, the autophagosomal membrane surrounding the peroxisomes appears to have fused with the vacuolar membrane. (c) At 2 h a peroxisome in the form of an autophagic body is seen within the vacuole. Magnified pictures of samples obtained at the (d) 20 min time point showing the nuclear endoplasmic reticulum membrane in close proximity to the membranes surrounding the peroxisomes, and at the (e) 1 h time point demonstrating peroxisomes surrounded by multiple autophagosomal membranes. (f) Kinetics of morphological changes in vacuoles and peroxisomal GFP-SKL. Other conditions are described in Materials and Methods, and are the same as in Fig. 4. (g) Fluorescence images taken after 2 h of ethanol adaptation of wild-type P. pastoris cells.
Figure 6
Effect of inhibitors on transport of peroxisomal GFP-SKL to, and degradation in, vacuoles during (a) glucose adaptation and (b) ethanol adaptation. Wortmannin and PMSF were dissolved in DMSO, and added to the glucose medium. (Filled circle) Control (2% DMSO); (open circle) 1 mM wortmannin (with 2% DMSO); (filled square) 3 mM PMSF (with 2% DMSO); (filled triangle) 10 mg/ml cycloheximide.
Figure 7
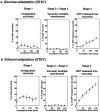
Microautophagic degradation of peroxisomes is not observed in a vacuolar protease-negative strain (STK7) of P. pastoris. Kinetics of morphological changes in vacuoles and peroxisomal GFP-SKL during (a) glucose adaptation and (b) ethanol adaptation. (c) Fluorescence images taken after 2 h of glucose adaptation. Arrows show GFP-SKL in vacuolar matrix. Some cells showed diffusion of GFP-SKL into the vacuolar matrix.
Figure 8
(a) Visualization of alcohol oxidase activity in colonies after (a) glucose adaptation for 8 h and ethanol adaptation for 24 h in wild-type (strain PPY12) and pag mutant cells (strains STK1-STK6, Materials and Methods) of P. pastoris. (b) Western-blot analysis of samples taken from cultures shifted from methanol to glucose for the indicated time. Antibodies used were AOX, alcohol oxidase; F1, mitochondrial F1β subunit; G6PDH, glucose-6-phosphate dehydrogenase. Growth curve of the wild-type strain PPY12 and the pag4 mutant (strain STK4) after shift from methanol to glucose.
Figure 9
Fluorescence images of (a) pag2 (strain STK2) and (b) pag3 (strain STK3) mutants of P. pastoris after a 3 h shift to glucose. (b) Arrows show deeply invaginated structures of vacuolar membranes surrounding peroxisomes in the pag3 mutant.
Figure 10
Fluorescence images of the pag4 (strain STK4) mutant of P. pastoris after (a) 0, (b) 3, or (c) 6 h of glucose adaptation. The vacuolar membrane proliferated extensively and surrounded peroxisomes during glucose adaptation.
Figure 11
Microautophagy of peroxisomes in a pex1-ts mutant (strain SJH242) of P. pastoris expressing GFP-SKL from the constitutive glyceraldehyde-3-phosphate dehydrogenase (GAPDH) promoter at the restrictive temperature for peroxisome assembly (34°C). (a) Kinetics of peroxisome degradation at 34°C. Strain SJH242 was induced on methanol at 23°C, and glucose adaptation was performed at 34°C. (b) Changes in vacuole morphology were seen even in the absence of normal peroxisomes. At 0 h, SJH242 cells were grown at 34°C when GFP-SKL was diffuse in the cytosol and many vacuoles showed spherical morphologies. After 2 h, ∼20–30% vacuoles showed complicated membrane structures representative of stage 2 cells.
Similar articles
- Divergent modes of autophagy in the methylotrophic yeast Pichia pastoris.
Tuttle DL, Dunn WA Jr. Tuttle DL, et al. J Cell Sci. 1995 Jan;108 ( Pt 1):25-35. doi: 10.1242/jcs.108.1.25. J Cell Sci. 1995. PMID: 7738102 - Glucose-induced microautophagy in Pichia pastoris requires the alpha-subunit of phosphofructokinase.
Yuan W, Tuttle DL, Shi YJ, Ralph GS, Dunn WA Jr. Yuan W, et al. J Cell Sci. 1997 Aug;110 ( Pt 16):1935-45. doi: 10.1242/jcs.110.16.1935. J Cell Sci. 1997. PMID: 9296392 - Labeling of peroxisomes with green fluorescent protein in living P. pastoris cells.
Monosov EZ, Wenzel TJ, Lüers GH, Heyman JA, Subramani S. Monosov EZ, et al. J Histochem Cytochem. 1996 Jun;44(6):581-9. doi: 10.1177/44.6.8666743. J Histochem Cytochem. 1996. PMID: 8666743 - Environmental response of yeast peroxisomes. Aspects of organelle assembly and degradation.
Sakai Y, Subramani S. Sakai Y, et al. Cell Biochem Biophys. 2000;32 Spring:51-61. doi: 10.1385/cbb:32:1-3:51. Cell Biochem Biophys. 2000. PMID: 11330070 Review. - Pexophagy: autophagic degradation of peroxisomes.
Sakai Y, Oku M, van der Klei IJ, Kiel JA. Sakai Y, et al. Biochim Biophys Acta. 2006 Dec;1763(12):1767-75. doi: 10.1016/j.bbamcr.2006.08.023. Epub 2006 Aug 24. Biochim Biophys Acta. 2006. PMID: 17005271 Review.
Cited by
- The Role of Autophagy in Skeletal Muscle Diseases.
Xia Q, Huang X, Huang J, Zheng Y, March ME, Li J, Wei Y. Xia Q, et al. Front Physiol. 2021 Mar 25;12:638983. doi: 10.3389/fphys.2021.638983. eCollection 2021. Front Physiol. 2021. PMID: 33841177 Free PMC article. Review. - Autophagy in yeast: mechanistic insights and physiological function.
Abeliovich H, Klionsky DJ. Abeliovich H, et al. Microbiol Mol Biol Rev. 2001 Sep;65(3):463-79, table of contents. doi: 10.1128/MMBR.65.3.463-479.2001. Microbiol Mol Biol Rev. 2001. PMID: 11528006 Free PMC article. Review. - PpATG9 encodes a novel membrane protein that traffics to vacuolar membranes, which sequester peroxisomes during pexophagy in Pichia pastoris.
Chang T, Schroder LA, Thomson JM, Klocman AS, Tomasini AJ, Strømhaug PE, Dunn WA Jr. Chang T, et al. Mol Biol Cell. 2005 Oct;16(10):4941-53. doi: 10.1091/mbc.e05-02-0143. Epub 2005 Aug 3. Mol Biol Cell. 2005. PMID: 16079180 Free PMC article. - Apg7p/Cvt2p is required for the cytoplasm-to-vacuole targeting, macroautophagy, and peroxisome degradation pathways.
Kim J, Dalton VM, Eggerton KP, Scott SV, Klionsky DJ. Kim J, et al. Mol Biol Cell. 1999 May;10(5):1337-51. doi: 10.1091/mbc.10.5.1337. Mol Biol Cell. 1999. PMID: 10233148 Free PMC article. - Lipid Droplets and Their Autophagic Turnover via the Raft-Like Vacuolar Microdomains.
Rahman MA, Kumar R, Sanchez E, Nazarko TY. Rahman MA, et al. Int J Mol Sci. 2021 Jul 29;22(15):8144. doi: 10.3390/ijms22158144. Int J Mol Sci. 2021. PMID: 34360917 Free PMC article. Review.
References
- Baba M, Osumi M, Ohsumi Y. Analysis of the membrane structures involved in autophagy in yeast by freeze-replica method. Cell Struct Funct. 1995;20:465–471. - PubMed
- Blommaart EF, Krause U, Schellens JP, Vreeling SH, Meijer AJ. The phosphatidylinositol 3-kinase inhibitors wortmannin and LY294002 inhibit autophagy in isolated rat hepatocytes. Eur J Biochem. 1997;243:240–246. - PubMed
- Bormann C, Sahm H. Degradation of microbodies in relation to activities of alcohol oxidase and catalase in Candida boidinii. . Arch Microbiol. 1978;117:67–72. - PubMed
- Chiang H-L, Schekman R, Hamamoto S. Selective uptake of cytosolic, peroxisomal, and plasma membrane proteins into the yeast lysosome for degradation. J Biol Chem. 1996;271:9934–9941. - PubMed
Publication types
MeSH terms
Substances
LinkOut - more resources
Full Text Sources
Other Literature Sources


