CD4+ T cell tolerance to parenchymal self-antigens requires presentation by bone marrow-derived antigen-presenting cells - PubMed (original) (raw)
CD4+ T cell tolerance to parenchymal self-antigens requires presentation by bone marrow-derived antigen-presenting cells
A J Adler et al. J Exp Med. 1998.
Abstract
T cell tolerance to parenchymal self-antigens is thought to be induced by encounter of the T cell with its cognate peptide-major histocompatibility complex (MHC) ligand expressed on the parenchymal cell, which lacks appropriate costimulatory function. We have used a model system in which naive T cell receptor (TCR) transgenic hemagglutinin (HA)-specific CD4+ T cells are adoptively transferred into mice expressing HA as a self-antigen on parenchymal cells. After transfer, HA-specific T cells develop a phenotype indicative of TCR engagement and are rendered functionally tolerant. However, T cell tolerance is not induced by peptide-MHC complexes expressed on parenchymal cells. Rather, tolerance induction requires that HA is presented by bone marrow (BM)-derived cells. These results indicate that tolerance induction to parenchymal self-antigens requires transfer to a BM-derived antigen-presenting cell that presents it to T cells in a tolerogenic fashion.
Figures
Figure 1
C3-HA transgene expression vector. The C3-HA transgene expression cassette consists of a 7.1-kb C3(1) HindIII–KpnI genomic fragment in which the 1.7-kb HA cDNA has been ligated into the second exon of C3(1). The natural initiation codon within the first exon of C3(1) was altered (*) so that translation would initiate and terminate within the HA cDNA sequence.
Figure 2
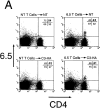
FACS® analysis of clonotypic HA-specific CD4 cells after adoptive transfer into C3-HA transgenic mice. HA-specific CD4 cells were retrieved from the LN of C3-HA and NT recipients 9 d after transfer of 2.5 × 10⁶ clonotypic cells. Two-color staining from representative transfer recipients (A) was performed using FITC-labeled anti-CD4 and biotinylated 6.5 followed by PE-labeled streptavidin. Clonotypic cells (upper right quadrant) stain positively for both CD4 and 6.5 surface markers. As controls, LN preparation taken from NT and C3-HA recipients of NT T cells were also stained. The relative percentage of cells in each quadrant is shown in the upper right corner of each plot with the percentage of cells in the upper right quadrant in larger print. Bar graph showing the average frequency of clonotypic CD4 cells in the different transfer recipient groups (mean ± SEM, n = 4) (B) Three color staining was performed using cy-chrome–labeled anti-CD4, FITC-labeled CD44 or CD45RB, and biotinylated 6.5 followed by PE-labeled streptavidin. (C) Histogram plots of representative clonotypic transfer recipients for CD44 and CD45RB expression on gated clonotypic (C) and nonclonotypic (NC) CD4 cells.
Figure 3
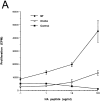
Clonotypic CD4 cells exhibit impaired response to antigenic stimulation after adoptive transfer into C3-HA transgenic recipients. (A) In vitro proliferative response of clonotypic cells, retrieved 9 d after transfer, to peptide stimulation. LN cells prepared from NT (closed circles; n = 3), C3-HA transgenic (open circles; n = 3), and control (closed squares; n = 1) recipients were cultured with the indicated concentration of synthetic HA peptide. (B) T cell proliferation was measured by [3H]thymidine incorporation, and data were expressed as the total number of incorporated radioactive counts (cpm, mean ± SEM). IL-2 secretion by clonotypic cells stimulated in vitro. Media were collected from 72-h cultures with (hatched bars) and without (solid bars) 100 μg/ml HA peptide and tested by ELISA. Data is expressed as pg/ ml IL-2 (mean ± SEM, n = 3).
Figure 4
Tolerized clonotypic T cells do not inhibit the proliferative response of naive clonotypic T cells in vitro. Equal parts of the indicated LN preparations taken from day 9 transfer recipients were combined; tolerized T cells with control cells (C3-HA + C), naive T cells with control cells (NT + C), and naive with tolerized T cells (NT + C3-HA). 1.5 × 10⁵ total cells were cultured in vitro with (hatched bars) or without (solid bars) 100 μg/ml HA peptide and proliferation was determined by [3H]thymidine incorporation (cpm, mean ± SEM, n = 3).
Figure 5
HA expression on BM-derived cells is not required for tolerance induction. C3-HA transgenic and NT mice were lethally irradiated and reconstituted with BM prepared from either NT or C3-HA donors. Clonotypic cells were retrieved 21 d after adoptive transfer from chimeric recipients: open circles, NT → NT (BM donor → irradiated recipient); closed circles, NT → C3-HA; open squares, C3-HA → NT; and closed squares, 3-HA → C3-HA. Proliferation assays were established as in Fig. 3_A_. Two-color FACS® analysis indicated that equivalent numbers of clonotypic cells were present in the various chimeras (data not shown). Each data point (mean ± SD) is derived from two animals. This experiment was representative of two independent trials (data not shown).
Figure 6
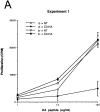
Tolerance induction is mediated by BM-derived cells which acquire HA via an antigen transfer pathway. C3-HA transgenic and NT mice (F1, bxd) were lethally irradiated and reconstituted with BM from NT donors of either the H-2d (HA-restricting) or H-2b (nonrestricting) haplotype. (A) Naive HA-specific CD4 cells (prepared from 6.5 TCR transgenic mice [F1, bxd]) were depleted of endogenous class II positive cells before adoptive transfer into parent → F1 chimeric recipients. LN cells prepared from day 14 adoptive transfer were tested for in vitro proliferative response to HA peptide; H-2d → H-2bxd/ HA (d → HA, closed circles), H-2b → H-2bxd/HA (b → HA, closed squares), H-2d → H-2bxd/NT (d → NT, open circles) and H-2b → H-2bxd/NT (b → NT, open squares). Experiments 1 and 2 are two independent trials in which each data point (mean ± SD) is derived from two separate mice, except for the b → NT group in experiment 1, which represents a single mouse. (B) Bar graph showing average clonotype frequencies from experiment 1 (mean ± SD). (C) Representative histogram plots of CD44 expression on the surface of clonotypic (C) and nonclonotypic (NC) T cells in experiment 1.
Similar articles
- Induction of alloreactive CD4 T cell tolerance in molecular chimeras: a possible role for regulatory T cells.
Forman D, Kang ES, Tian C, Paez-Cortez J, Iacomini J. Forman D, et al. J Immunol. 2006 Mar 15;176(6):3410-6. doi: 10.4049/jimmunol.176.6.3410. J Immunol. 2006. PMID: 16517709 - CD4 cell priming and tolerization are differentially programmed by APCs upon initial engagement.
Higgins AD, Mihalyo MA, McGary PW, Adler AJ. Higgins AD, et al. J Immunol. 2002 Jun 1;168(11):5573-81. doi: 10.4049/jimmunol.168.11.5573. J Immunol. 2002. PMID: 12023353 - Steady state dendritic cells present parenchymal self-antigen and contribute to, but are not essential for, tolerization of naive and Th1 effector CD4 cells.
Hagymasi AT, Slaiby AM, Mihalyo MA, Qui HZ, Zammit DJ, Lefrancois L, Adler AJ. Hagymasi AT, et al. J Immunol. 2007 Aug 1;179(3):1524-31. doi: 10.4049/jimmunol.179.3.1524. J Immunol. 2007. PMID: 17641018 Free PMC article. - Cross-presentation of self antigens to CD8+ T cells: the balance between tolerance and autoimmunity.
Kurts C, Heath WR, Carbone FR, Kosaka H, Miller JF. Kurts C, et al. Novartis Found Symp. 1998;215:172-81; discussion 181-90. doi: 10.1002/9780470515525.ch13. Novartis Found Symp. 1998. PMID: 9760579 Review. - T and B cell tolerance and responses to viral antigens in transgenic mice: implications for the pathogenesis of autoimmune versus immunopathological disease.
Zinkernagel RM, Pircher HP, Ohashi P, Oehen S, Odermatt B, Mak T, Arnheiter H, Bürki K, Hengartner H. Zinkernagel RM, et al. Immunol Rev. 1991 Aug;122:133-71. doi: 10.1111/j.1600-065x.1991.tb00601.x. Immunol Rev. 1991. PMID: 1937540 Review.
Cited by
- Role of PD-1 and its ligand, B7-H1, in early fate decisions of CD8 T cells.
Goldberg MV, Maris CH, Hipkiss EL, Flies AS, Zhen L, Tuder RM, Grosso JF, Harris TJ, Getnet D, Whartenby KA, Brockstedt DG, Dubensky TW Jr, Chen L, Pardoll DM, Drake CG. Goldberg MV, et al. Blood. 2007 Jul 1;110(1):186-92. doi: 10.1182/blood-2006-12-062422. Epub 2007 Mar 28. Blood. 2007. PMID: 17392506 Free PMC article. - Tumor growth enhances cross-presentation leading to limited T cell activation without tolerance.
Nguyen LT, Elford AR, Murakami K, Garza KM, Schoenberger SP, Odermatt B, Speiser DE, Ohashi PS. Nguyen LT, et al. J Exp Med. 2002 Feb 18;195(4):423-35. doi: 10.1084/jem.20010032. J Exp Med. 2002. PMID: 11854356 Free PMC article. - Memory-like CD8+ and CD4+ T cells cooperate to break peripheral tolerance under lymphopenic conditions.
Le Saout C, Mennechet S, Taylor N, Hernandez J. Le Saout C, et al. Proc Natl Acad Sci U S A. 2008 Dec 9;105(49):19414-9. doi: 10.1073/pnas.0807743105. Epub 2008 Nov 25. Proc Natl Acad Sci U S A. 2008. PMID: 19033460 Free PMC article. - Tc17 CD8 T cells: functional plasticity and subset diversity.
Yen HR, Harris TJ, Wada S, Grosso JF, Getnet D, Goldberg MV, Liang KL, Bruno TC, Pyle KJ, Chan SL, Anders RA, Trimble CL, Adler AJ, Lin TY, Pardoll DM, Huang CT, Drake CG. Yen HR, et al. J Immunol. 2009 Dec 1;183(11):7161-8. doi: 10.4049/jimmunol.0900368. Epub 2009 Nov 16. J Immunol. 2009. PMID: 19917680 Free PMC article. - Cell death in the maintenance and abrogation of tolerance: the five Ws of dying cells.
Griffith TS, Ferguson TA. Griffith TS, et al. Immunity. 2011 Oct 28;35(4):456-66. doi: 10.1016/j.immuni.2011.08.011. Immunity. 2011. PMID: 22035838 Free PMC article. Review.
References
- Kappler J, Roehm M, Marrack P. T cell tolerance by clonal elimination in the thymus. Cell. 1987;49:273–280. - PubMed
- von Boehmer H, Kisielow P. Self-nonself discrimination by T cells. Science. 1990;248:1369–1373. - PubMed
- Ohashi PS, Oehen S, Buerki K, Pircher H, Ohashi CT, Odermatt B, Malissen B, Zinkernagel RM, Hengartner H. Ablation of “tolerance” and induction of diabetes by virus infection in viral antigen transgenic mice. Cell. 1991;65:305–317. - PubMed
- Oldstone MB, Nerenberg M, Southern P, Price J, Lewicki H. Virus infection triggers insulin-dependent diabetes mellitus in a transgenic model: role of anti-self (virus) immune response. Cell. 1991;65:319–331. - PubMed
Publication types
MeSH terms
Substances
LinkOut - more resources
Full Text Sources
Other Literature Sources
Molecular Biology Databases
Research Materials


