Identification of primary initiation sites for DNA replication in the hamster dihydrofolate reductase gene initiation zone - PubMed (original) (raw)
Identification of primary initiation sites for DNA replication in the hamster dihydrofolate reductase gene initiation zone
T Kobayashi et al. Mol Cell Biol. 1998 Jun.
Abstract
Mammalian replication origins appear paradoxical. While some studies conclude that initiation occurs bidirectionally from specific loci, others conclude that initiation occurs at many sites distributed throughout large DNA regions. To clarify this issue, the relative number of early replication bubbles was determined at 26 sites in a 110-kb locus containing the dihydrofolate reductase (DHFR)-encoding gene in CHO cells; 19 sites were located within an 11-kb sequence containing ori-beta. The ratio of approximately 0.8-kb nascent DNA strands to nonreplicated DNA at each site was quantified by competitive PCR. Nascent DNA was defined either as DNA that was labeled by incorporation of bromodeoxyuridine in vivo or as RNA-primed DNA that was resistant to lambda-exonuclease. Two primary initiation sites were identified within the 12-kb region, where two-dimensional gel electrophoresis previously detected a high frequency of replication bubbles. A sharp peak of nascent DNA occurred at the ori-beta origin of bidirectional replication where initiation events were 12 times more frequent than at distal sequences. A second peak occurred 5 kb downstream at a previously unrecognized origin (ori-beta'). Thus, the DHFR gene initiation zone contains at least three primary initiation sites (ori-beta, ori-beta', and ori-gamma), suggesting that initiation zones in mammals, like those in fission yeast, consist of multiple replication origins.
Figures
FIG. 1
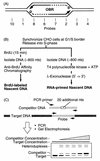
Mapping replication origins by the nascent DNA strand abundance assay. (A) Early replication bubbles contain an OBR and two RNA-primed (box) nascent DNA strands (the arrow indicates the direction of growth). (B) Nascent DNA strands from early replication bubbles were isolated either as newly synthesized (BrdU-labeled) DNA or as RNA-primed DNA with an average length of ∼0.8 kb. (C) Competitive PCR was used to measure the relative abundance of specific probe sequences. nts, nucleotides.
FIG. 2
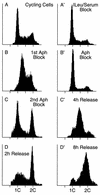
FACS analyses of CHO K1 cell synchronization procedures. CHO cell synchronization was evaluated by staining nuclei with Cycle Test Plus (Becton Dickinson) and measuring their DNA content by flow cytometry (FACScan; Becton Dickinson). Between 5,000 and 10,000 fluorescent events were counted. (A to D) Double aphidicolin block. (A) Randomly proliferating cells; (B) cells in the first aphidicolin block; (C) cells in the second aphidicolin block; (D) cells 2 h after release from the second aphidicolin block. (A′ to D′) Isoleucine-serum-aphidicolin block. (A′) Cells arrested by depletion of isoleucine and fetal calf serum; (B′) cells released into aphidicolin; (C′ and D′) cells released from aphidicolin for 4 h (C′) and 8 h (D′).
FIG. 3
PCR primer sets used to map the ori-β region. Primer sets H, I, J, G, F, and K in this study are the same sites as A, B, C, D, E and F (30), respectively. Their DNA sequences were determined from plasmids pDGKS-H, pDGKS-I, pDGKS-J, pDGKS-G, pDGKS-F, and pDGKS-K (25), respectively, originally cloned by H. Cedar. DNA sequences of primer sets P and O were determined from plasmids pDGKS-P and pDGKS-O (25), respectively, originally cloned by J. Hamlin. Primer sets for probes 1 to 19 and F were taken from the 10,825 sequenced nucleotides [Map Position (bp)] now available (GenBank accession no. X94372 and AF028017). Primer sets H, I, J, G, K, P, and O are identical to probes of the same name in reference , and primer sets 6, 7, and 9 are similar to probes C, D, and R (6). Primer set 8 is similar to primer set 8 in reference . The direction of transcription of the DHFR and 2BE2121 genes is indicated with arrows. ori-β is defined by the data summarized in Fig. 7, ori-β′ is defined by the data in Fig. 5 and 6, and ori-γ is defined by the data in references , , , and . The initiation zone is defined by data in references , , and . The distance from the 3′ end of the DHFR gene is based on restriction fragment analyses of plasmids and cosmids. Primer sequences are provided in Table 1.
FIG. 4
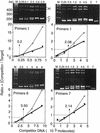
Use of competitive PCR to quantify the amount of a specific sequence. A fixed amount of newly synthesized Br-DNA was amplified in the presence of increasing amounts of the indicated competitor molecules (primer sets I, 1, 6, and 7). DNA products were resolved by gel electrophoresis and stained with ethidium bromide (upper panels). The amount of competitor DNA added to the PCR mixture is indicated above each lane. Lanes M contain a 100-bp DNA ladder. Lanes C lacked target DNA. Lanes T lacked competitor DNA. Two heteroduplex DNA bands consisting of either T · C or C · T are indicated by H. The ratio of competitor DNA to target DNA was determined by quantifying the fraction of DNA in each of the four major bands by densitometry (lower panels). This ratio was plotted as a function of the amount of competitor DNA added to the PCR assay: C/T versus [competitor added] (open symbols, thin line), and [C + H/2] / [T + H/2] versus [competitor added] (solid symbols, heavy line; H = T · C + C · T). The thin lines with open symbols take into account heteroduplex DNA. The amount of target DNA determined in each example is given.
FIG. 5
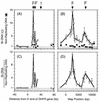
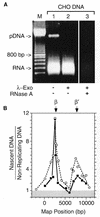
Mapping replication origins with newly synthesized BrdU-labeled DNA from early replication bubbles. (A) The relative abundance of 26 different probes (Fig. 3) was determined on five samples of nonreplicating DNA (▪) and on five samples of newly synthesized Br-DNA (□) chains with an average length of ∼0.8 kb by competitive PCR. The mean values and the standard errors of the mean are shown. The amount of each probe was normalized to the average of probes H, I, and J (the region where 2D gel electrophoresis has never detected replication bubbles). Therefore, numbers of unity or less (shaded area) indicate absence of initiation events. Since most of the region from −40 to +80 kb has not been sequenced (Fig. 3), the distance from the 3′ end of the DHFR gene was plotted. (B) Since most of the region from 12 to 27 kb downstream of the 3′-end of the DHFR gene has been sequenced (Fig. 3), the nucleotide map positions of these data in panel A were plotted. (C) The ratios of Br-DNA to nonreplicating DNA were calculated (○) in each of the five experiments and averaged. (D) Data in the region from 12 to 27 kb downstream of the 3′ end of the DHFR gene in panel C were replotted on their nucleotide map position. The positions of ori-β, ori-β′, and ori-γ OBRs are indicated.
FIG. 6
Mapping replication origins with RNA-primed DNA from early replication bubbles. DNA with an average length of ∼0.8 kb was enriched for RNA-primed nascent DNA chains by treatment first with T4 polynucleotide kinase plus ATP to ensure that all 5′-DNA ends were phosphorylated and then with λ-exonuclease to degrade all 5′-phosphorylated-DNA chains (Fig. 1B). Linear, dephosphorylated pUC18 DNA was included as an internal control. (A) An aliquot of the sample was fractionated by electrophoresis in a 1% agarose gel before (lane 1) and after (lane 2) λ-exonuclease treatment. A sample of the λ-exonuclease-treated material was later digested with RNase A (lane 3). A 100-bp DNA ladder (Pharmacia Biotech) was run in parallel to provide size markers (M). (B) Two preparations of the T4 kinase/λ-exonuclease-treated material were used to determine the relative abundance of RNA-primed nascent DNA chains (▪) ∼0.8 kb long by competitive PCR. These results are compared with the relative abundance of BrdU-labeled nascent DNA chains (○) of the same size class.
FIG. 7
Comparison of results from the nascent DNA strand abundance assay with results from other nascent DNA strand origin-mapping strategies. Six different methods for mapping replication origins reveal a primary initiation site for DNA replication in CHO cells that can be localized to a 2-kb region encompassing the original ori-β OBR identified by the transition between leading- and lagging-strand synthesis ( ) (6). (A) Leading-strand distribution (7, 30); (B) earliest labeled DNA fragment (4, 5, 25, 34, 43, 59); (C) nascent DNA strand length (53); (D) nascent DNA strand abundance in unsynchronized cells (47); (E) nascent DNA strand abundance in synchronized cells (this paper) (–––, Br-DNA; ——, RNA-DNA); (F) replication bubble trap (1); (G and H) Okazaki fragment distribution (6, 52). Lightly shaded rectangles indicate the outer limits of the origin, while solid rectangles indicate the region of maximum origin activity. For example, the outer limits of the initiation site described here (E) are between primer sites 10 and 5, while the center is between primer sites 8 and 7 (Fig. 6). These data show that most initiation events occur within the 2-kb locus indicated by the dashed box. The highest Br-DNA/nonreplicating DNA ratios were routinely observed at probe 6 (nucleotides 2464 to 2619). The ori-β OBR is located between nucleotides 2431 and 2914, ∼17 kb downstream of the DHFR gene.
Similar articles
- Initiation sites are distributed at frequent intervals in the Chinese hamster dihydrofolate reductase origin of replication but are used with very different efficiencies.
Dijkwel PA, Wang S, Hamlin JL. Dijkwel PA, et al. Mol Cell Biol. 2002 May;22(9):3053-65. doi: 10.1128/MCB.22.9.3053-3065.2002. Mol Cell Biol. 2002. PMID: 11940663 Free PMC article. - The dihydrofolate reductase origin of replication does not contain any nonredundant genetic elements required for origin activity.
Mesner LD, Li X, Dijkwel PA, Hamlin JL. Mesner LD, et al. Mol Cell Biol. 2003 Feb;23(3):804-14. doi: 10.1128/MCB.23.3.804-814.2003. Mol Cell Biol. 2003. PMID: 12529386 Free PMC article. - Distal sequences, but not ori-beta/OBR-1, are essential for initiation of DNA replication in the Chinese hamster DHFR origin.
Kalejta RF, Li X, Mesner LD, Dijkwel PA, Lin HB, Hamlin JL. Kalejta RF, et al. Mol Cell. 1998 Dec;2(6):797-806. doi: 10.1016/s1097-2765(00)80294-4. Mol Cell. 1998. PMID: 9885567 - Origins of DNA replication in metazoan chromosomes.
DePamphilis ML. DePamphilis ML. J Biol Chem. 1993 Jan 5;268(1):1-4. J Biol Chem. 1993. PMID: 8416916 Review. - Sequence and context effects on origin function in mammalian cells.
Dijkwel PA, Hamlin JL. Dijkwel PA, et al. J Cell Biochem. 1996 Aug;62(2):210-22. doi: 10.1002/(SICI)1097-4644(199608)62:2%3C210::AID-JCB9%3E3.0.CO;2-V. J Cell Biochem. 1996. PMID: 8844401 Review.
Cited by
- The chromatin environment shapes DNA replication origin organization and defines origin classes.
Cayrou C, Ballester B, Peiffer I, Fenouil R, Coulombe P, Andrau JC, van Helden J, Méchali M. Cayrou C, et al. Genome Res. 2015 Dec;25(12):1873-85. doi: 10.1101/gr.192799.115. Epub 2015 Nov 11. Genome Res. 2015. PMID: 26560631 Free PMC article. - The hunt for origins of DNA replication in multicellular eukaryotes.
Urban JM, Foulk MS, Casella C, Gerbi SA. Urban JM, et al. F1000Prime Rep. 2015 Mar 3;7:30. doi: 10.12703/P7-30. eCollection 2015. F1000Prime Rep. 2015. PMID: 25926981 Free PMC article. Review. - Initiation of DNA Replication in the Human Genome.
Valenzuela MS. Valenzuela MS. Hereditary Genet. 2012 Feb 8;Suppl 1(3):4903. doi: 10.4172/2161-1041.S1-003. Hereditary Genet. 2012. PMID: 24511453 Free PMC article. - Replication of Epstein-Barr viral DNA.
Hammerschmidt W, Sugden B. Hammerschmidt W, et al. Cold Spring Harb Perspect Biol. 2013 Jan 1;5(1):a013029. doi: 10.1101/cshperspect.a013029. Cold Spring Harb Perspect Biol. 2013. PMID: 23284049 Free PMC article. Review. - Prevention of transcriptional silencing by a replicator-binding complex consisting of SWI/SNF, MeCP1, and hnRNP C1/C2.
Huang L, Fu H, Lin CM, Conner AL, Zhang Y, Aladjem MI. Huang L, et al. Mol Cell Biol. 2011 Aug;31(16):3472-84. doi: 10.1128/MCB.05587-11. Epub 2011 Jun 20. Mol Cell Biol. 2011. PMID: 21690294 Free PMC article.
References
- Anderson S, DePamphilis M L. Metabolism of Okazaki fragments during simian virus 40 DNA replication. J Biol Chem. 1979;254:11495–11504. - PubMed
- Bielinsky A K, Gerbi S A. Discrete start sites for DNA synthesis in the yeast ARS1 origin. Science. 1998;279:95–98. - PubMed
- Burhans W C, Selegue J E, Heintz N H. Replication intermediates formed during initiation of DNA synthesis in methotrexate-resistant CHOC 400 cells are enriched for sequences derived from a specific, amplified restriction fragment. Biochemistry. 1986;25:441–449. - PubMed
Publication types
MeSH terms
Substances
LinkOut - more resources
Full Text Sources
