A unified statistical framework for sequence comparison and structure comparison - PubMed (original) (raw)
A unified statistical framework for sequence comparison and structure comparison
M Levitt et al. Proc Natl Acad Sci U S A. 1998.
Abstract
We present an approach for assessing the significance of sequence and structure comparisons by using nearly identical statistical formalisms for both sequence and structure. Doing so involves an all-vs.-all comparison of protein domains [taken here from the Structural Classification of Proteins (scop) database] and then fitting a simple distribution function to the observed scores. By using this distribution, we can attach a statistical significance to each comparison score in the form of a P value, the probability that a better score would occur by chance. As expected, we find that the scores for sequence matching follow an extreme-value distribution. The agreement, moreover, between the P values that we derive from this distribution and those reported by standard programs (e.g., BLAST and FASTA validates our approach. Structure comparison scores also follow an extreme-value distribution when the statistics are expressed in terms of a structural alignment score (essentially the sum of reciprocated distances between aligned atoms minus gap penalties). We find that the traditional metric of structural similarity, the rms deviation in atom positions after fitting aligned atoms, follows a different distribution of scores and does not perform as well as the structural alignment score. Comparison of the sequence and structure statistics for pairs of proteins known to be related distantly shows that structural comparison is able to detect approximately twice as many distant relationships as sequence comparison at the same error rate. The comparison also indicates that there are very few pairs with significant similarity in terms of sequence but not structure whereas many pairs have significant similarity in terms of structure but not sequence.
Figures
Figure 1
A probability–density distribution for sequence comparison scores, ρseqo, contoured against Sseq, the sequence alignment score (along the horizontal axis) and ln(nm), where n and m are the lengths of the pair sequences (along the vertical axis). This density is related closely to the raw data (via normalization) obtained by counting the number of pairs with particular S and ln(nm) values. Because of the wide range of density values, contours of log(ρseqo) are drawn with an interval of 1 (a full order of magnitude). When contouring the logarithm of a density function, special attention must be paid to the zero values. Here, a zero value is set to 0.001, which effectively lifts the entire surface by 3 log units. The data then are smoothed by averaging with a Gaussian function [exp(−s/(ΔSseq/3)2)] over a window 14 units wide along the Sseq axis. This smoothing together with the treatment of zeros serves to emphasize the smallest observed counts (values of 1) by surrounding them with three contour levels. (A) Data from all 884,540 pairs between any one of the 941 sequences and any other sequence (pairs A–B and B–A are both included). The significant sequence matches are seen as the isolated spots at high values of the score Sseq. (B) Data from 352,168 pairs, including only those pairs of sequences in different scop classes. We also exclude pairs between an all-α or all-β domain and an α+β domain, as well as sequences that are not in one of the five main scop classes: α, β, α/β, α+β, and α+β (multidomain). This exclusion is done to ensure that no significant matches will be found, which indeed is seen in the figure by the absence of any outlying spots at high score values. Thus, the density in B is free of any significant matches and shows the underlying density distribution expected for comparison of unrelated sequences.
Figure 2
Cross-sections of the sequence and structure density distribution show they are both extreme-value distributions and that the calculated distribution fits the observed distribution well. (A) Plots of the logarithm of the observed, log(ρseqo), and calculated, log(ρseqc), sequence pair densities against the sequence match score Sseq; log(ρseqo) is taken from the data for pairs in different classes (Fig. 1_B_). Each panel shows the variation of the density with Sseq for a particular value of ln(nm), the product of the lengths of the sequences compared; this value is indicated by assuming n = m and showing the value of n. The observed density is clearly an extreme-value distribution with a linear fall-off of log(ρseqo) with Sseq. The calculated distribution obtained with a two-parameter fit (dashed line, see text) is a good fit for all values of n [or ln(nm)]. (B) Plots of the logarithm of the observed, log(ρstro), and calculated, log(ρstrc), structure pair densities against the structure match score Sstro; log(ρstro) taken from the data for pairs in different classes (Fig. 4_B_). Each panel shows the variation of the density with Sstr for a particular value of the number of aligned residues, N. The calculated distribution obtained with a five-parameter fit (dashed line, see text) is a good fit for all values of N.
Figure 3
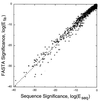
The statistical significance derived here is shown to be similar to that derived in a completely different way by the sequence comparison program
ssearch
from the
fasta
package (13). We plotted the expected number of errors per search of the database obtained by Pearson’s method, log(Efa), against the same value calculated here, log(Eseq) (which is a function of the sequence match score Sseq and the length of the two sequences). To be more specific, Efa is the E value output by the
fasta–ssearch
program whereas Eseq is calculated as 940Pseq(s > Sseq) for score Sseq. The accuracy of our simple two-parameter fit is confirmed by the fact that most pairs of log(Efa) and log(Eseq) values are perfectly correlated, lying along the line log(Efa) = log(Eseq) over the entire range.
Figure 4
The logarithm of the density distribution for structure comparison scores, ρsteo, is contoured against Sstr, the structural alignment score (along the horizontal axis), and N, the number of aligned residues (along the vertical axis). By following the protocol used for Fig. 1, the raw data obtained by counting the number of pairs with the particular Sstr and N values are “lifted” and smoothed over a window 90 units wide along the Sstr axis, and the log value is contoured in intervals of 1 log unit. Given the different scales used for Sseq and Sstr, the extent of smoothing is very similar for both. (A) Data from all 884,540 pairs between any one of the 941 sequences and any other sequence. (B) Data from 352,168 pairs, including only those pairs of sequences in different scop classes (described in Fig. 1). Comparison of A and B shows that the true-positive structural matches are seen in the contours at the higher values of the alignment score Sstr, and also at higher values of the number of matches N. The density in B is free of these significant matches and shows the underlying density distribution expected for comparison of unrelated structures.
Figure 5
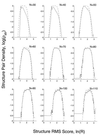
The fit to the structure pair density by using the rms score. The observed, log(ρstro), and calculated, log(ρstrc), structure pair density distributions are plotted against the rms score ln(R) for different numbers of aligned residues, N. The observed structure pair density, which is derived from pairs in different classes, is clearly not an extreme-value distribution because it is symmetrical about the maximum value and falls off faster than a linear function with increasing Z. In fact, it is best fit by exp(−Z4). The calculated distribution obtained with a five-parameter fit (dashed line) is a good fit when the number of aligned residues exceeds 50.
Figure 6
Comparison of structure significance with sequence significance. Plots of the structure significance, log(Estr), against the sequence significance, log(Eseq), for the 2,107 pairs of proteins judged to be homologous in the scop database (in the same superfamily). Pairs are distinguished by the extent of their structural match, with solid squares used for pairs with N ≥ 70 and unfilled diamonds used for N < 70. The horizontal and vertical dashed lines, which divide the figure into four quadrants, are at log(Estr) = −2 and at log(Eseq) = −2, respectively. Both of these thresholds correspond to an E value of 10−2 and_P_ value of 10−2/941 = 10−5 so that we judge matches with lower values to be significant at the 1% level.
Similar articles
- Effective protein sequence comparison.
Pearson WR. Pearson WR. Methods Enzymol. 1996;266:227-58. doi: 10.1016/s0076-6879(96)66017-0. Methods Enzymol. 1996. PMID: 8743688 - Assessing sequence comparison methods with reliable structurally identified distant evolutionary relationships.
Brenner SE, Chothia C, Hubbard TJ. Brenner SE, et al. Proc Natl Acad Sci U S A. 1998 May 26;95(11):6073-8. doi: 10.1073/pnas.95.11.6073. Proc Natl Acad Sci U S A. 1998. PMID: 9600919 Free PMC article. - A model for statistical significance of local similarities in structure.
Stark A, Sunyaev S, Russell RB. Stark A, et al. J Mol Biol. 2003 Mar 7;326(5):1307-16. doi: 10.1016/s0022-2836(03)00045-7. J Mol Biol. 2003. PMID: 12595245 Review. - Pairwise statistical significance and empirical determination of effective gap opening penalties for protein local sequence alignment.
Agrawal A, Brendel VP, Huang X. Agrawal A, et al. Int J Comput Biol Drug Des. 2008;1(4):347-67. doi: 10.1504/ijcbdd.2008.022207. Int J Comput Biol Drug Des. 2008. PMID: 20063463 Review.
Cited by
- An efficient algorithm for protein structure comparison using elastic shape analysis.
Srivastava S, Lal SB, Mishra DC, Angadi UB, Chaturvedi KK, Rai SN, Rai A. Srivastava S, et al. Algorithms Mol Biol. 2016 Sep 29;11:27. doi: 10.1186/s13015-016-0089-1. eCollection 2016. Algorithms Mol Biol. 2016. PMID: 27708689 Free PMC article. - Molecular modeling of phosphorylation sites in proteins using a database of local structure segments.
Plewczynski D, Jaroszewski L, Godzik A, Kloczkowski A, Rychlewski L. Plewczynski D, et al. J Mol Model. 2005 Nov;11(6):431-8. doi: 10.1007/s00894-005-0235-z. Epub 2005 Aug 11. J Mol Model. 2005. PMID: 16094535 - RNA and protein 3D structure modeling: similarities and differences.
Rother K, Rother M, Boniecki M, Puton T, Bujnicki JM. Rother K, et al. J Mol Model. 2011 Sep;17(9):2325-36. doi: 10.1007/s00894-010-0951-x. Epub 2011 Jan 22. J Mol Model. 2011. PMID: 21258831 Free PMC article. Review. - Protein structure alignment beyond spatial proximity.
Wang S, Ma J, Peng J, Xu J. Wang S, et al. Sci Rep. 2013;3:1448. doi: 10.1038/srep01448. Sci Rep. 2013. PMID: 23486213 Free PMC article. - Comparative analysis of methods for evaluation of protein models against native structures.
Olechnovič K, Monastyrskyy B, Kryshtafovych A, Venclovas Č. Olechnovič K, et al. Bioinformatics. 2019 Mar 15;35(6):937-944. doi: 10.1093/bioinformatics/bty760. Bioinformatics. 2019. PMID: 30169622 Free PMC article.
References
- Rohlf F, Slice D. Syst Zool. 1990;39:40–59.
- Bookstein F L. Morphometric Tools for Landmark Data. Cambridge, U.K.: Cambridge Univ. Press; 1991.
- Subbiah S, Laurents D V, Levitt M. Curr Biol. 1993;3:141–148. - PubMed
Publication types
MeSH terms
Substances
LinkOut - more resources
Full Text Sources
Other Literature Sources
Research Materials
Miscellaneous


