A single receptor encoded by vzg-1/lpA1/edg-2 couples to G proteins and mediates multiple cellular responses to lysophosphatidic acid - PubMed (original) (raw)
A single receptor encoded by vzg-1/lpA1/edg-2 couples to G proteins and mediates multiple cellular responses to lysophosphatidic acid
N Fukushima et al. Proc Natl Acad Sci U S A. 1998.
Abstract
Extracellular lysophosphatidic acid (LPA) produces diverse cellular responses in many cell types. Recent reports of several molecularly distinct G protein-coupled receptors have raised the possibility that the responses to LPA stimulation could be mediated by the combination of several uni-functional receptors. To address this issue, we analyzed one receptor encoded by ventricular zone gene-1 (vzg-1) (also referred to as lpA1/edg-2) by using heterologous expression in a neuronal and nonneuronal cell line. VZG-1 expression was necessary and sufficient in mediating multiple effects of LPA: [3H]-LPA binding, G protein activation, stress fiber formation, neurite retraction, serum response element activation, and increased DNA synthesis. These results demonstrate that a single receptor, encoded by vzg-1, can activate multiple LPA-dependent responses in cells from distinct tissue lineages.
Figures
Figure 1
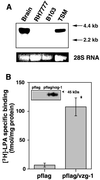
Epitope-tagged VZG-1 is expressed and functionally increases [3H]-LPA binding in plasma membranes of RH7777 hepatoma expressing no vzg-1. (A) Cytoplasmic RNAs (20 μg) from RH7777 hepatoma or B103 neuroblastoma cell line serum-starved for 24 h were subjected to Northern blot analysis (24) along with vzg-1 containing RNAs from brain and TSM, a cortical neuroblast cell line. Loading control, 28S RNA. (B) [3H]-LPA binding in plasma membranes of RH7777 cells transiently transfected with pflag or pflag/vzg-1. Specific binding in pflag/vzg-1-transfected cells was 6.4 ± 0.9 cpm/μg protein, 60% of total binding. Data are the mean ± SEM (n = 3). ∗, P < 0.05 (using Student’s t test) vs. pflag-transfected cells. (Inset) Immunoprecipitation with anti-flag antibody after [35S]-methionine/cysteine labeling of pflag or pflag/vzg-1-transfected cells reveals a protein band of predicted size only in pflag/vzg-1-transfected cells.
Figure 2
VZG-1 directly couples to Gi and other G proteins in plasma membranes after LPA stimulation. (A) Effect of LPA on [35S]-GTPγS binding to membranes from RH7777 cells transiently transfected with pflag or pflag/vzg-1. Basal [35S]-GTPγS binding (no LPA) was 64.8 ± 5.3 (pflag) and 100.7 ± 6.8 (pflag/vzg-1) cpm/μg protein. Data are expressed as a percentage of control (no LPA) and represent the mean ± SEM (n = 3–4). ∗, P < 0.05 vs. no LPA (using Student’s t test). (B) Effect of LPA on [35S]-GTPγS binding to membranes of control and experimental B103 stable cell lines and cortical neuroblast cell line TSM. Basal [35S]-GTPγS binding was 45.7 ± 2.5 (B103), 61.9 ± 2.1 (E-7), 57.2 ± 4.2 (A-5), 72.6 ± 3.7 (S-3), 73.9 ± 5.5 (S-7), and 83.3 ± 5.8 (TSM) cpm/μg protein. Data are expressed as described in A (n ≥ 3). ∗, P < 0.05 (using Student’s t test) vs. no LPA. (C) Effect of PTX treatment on LPA-induced [35S]-GTPγS binding in clone S-3. Cells were treated without or with PTX. Basal [35S]-GTPγS binding was 72.6 ± 3.4 (no PTX) and 71.1 ± 1.3 (PTX) cpm/μg protein. (Inset) Autoradiogram of PTX-catalyzed [32P]-ADP ribosylation in membranes of S-3 cells pretreated without (Left) or with PTX (Right) demonstrates PTX functionality. Data are expressed as described in A (n = 3). ∗, P < 0.05 (using Student’s _t_test) vs. no LPA. #, P < 0.05 vs. no PTX. (D) Effect of structurally related phospholipids on [35S]-GTPγS binding in clone S-3. Basal [35S]-GTPγS binding was 91.9 ± 20.2 cpm/μg protein. Data are expressed as described in A (n = 3). ∗, P < 0.05 (using Student’s t test) vs. no LPA. (E) VZG-1 couples to Gi after LPA stimulation. A-5 or S-3 cell membranes were labeled with [35S]-GTPγS, and Gαi protein was immunoprecipitated as described in Experimental Procedures. Basal binding in the immunoprecipitates was 15.2 ± 4.7 (A-5) or 20.0 ± 6.9 cpm/μg protein (S-3). Data are expressed as described in A (n = 3). ∗, P < 0.05 (using Student’s t test) vs. no LPA. (F) Western blot demonstrates expression of G proteins thought to mediate LPA signaling in mouse brain, B103, and RH7777 cell lines. Isolated membranes (50 μg) were subjected to Western blotting, as described (13). See Table 1 and Experimental Procedures for abbreviations.
Figure 3
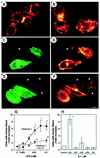
VZG-1 mediates stress fiber formation by LPA in RH7777 cells through Rho activation. Immunofluorescent microscopy of RH7777 cells transfected with pflag (A and B) or pflag/vzg-1 (C to E) and then exposed to LPA at 0 nM (A, C, and D) or 100 nM (B, E, and F) for 15 min. Cells were fixed and double-labeled for flag-epitope (using M2 antibody visualized by indirect immunofluorescence using fluorescein isothiocyanate; C and E) and actin (visualized with TRITC-phalloidin; A, B, D, and F). Note that stress fibers are observed only with VZG-1 expression and LPA exposure (E and F). Arrowheads, nontransfected cells. (Bar = 10 μm.) (G) Effect of his-C3 exoenzyme on LPA-induced stress fiber formation in VZG-1-expressing cells. RH7777 cells transfected with pflag/vzg-1 were treated without or with his-C3 exoenzyme, exposed to varying concentrations of LPA, and double-labeled for flag epitope and actin. The change in the number of double-labeled cells with stress fibers after LPA exposure compared with control (no LPA) was expressed as “fold increase.” Data are the mean ± SEM (n = 4). ∗, P < 0.05 (using Student’s t test) vs. no LPA. #, P < 0.05 vs. no C3 exoenzyme. (H) Effect of structurally related phospholipids on VZG-1-mediated stress fiber formation in pflag/vzg-1-transfected RH7777 cells. Data are the mean ± SEM (n = 3). ∗, P < 0.05 (using Student’s t test) vs. no LPA. See Experimental Procedures for abbreviations.
Figure 4
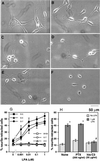
VZG-1 is required for LPA-dependent neurite retraction/cell rounding through Rho activation. Phase contrast microscopy of parental B103 cells (A and B), stable clone for antisense vzg-1 (clone A-5; C and D) or a stable clone for sense vzg-1 (clone S-3; E and F). Cells were treated with control vehicle buffer (A, C, and E) or with 1 μM LPA (B, D, and F) for 30 min. Only the sense-transfected cells exposed to LPA retracted neurites (F). (G) Dose–response relationship of LPA to neurite retraction in control and experimental B103 stable cell lines. Three independently derived, sense-expressing cell lines (S-3, S-4, and S-7) were compared with control cell lines (B103, parental line; E-7, empty vector-transfected line; and A-5, antisense-transfected line). Cells were treated with varying concentrations of LPA and fixed, and the percentages of neurite-retracted cells were determined. Data are the mean ± SEM (n ≥ 3). Only vzg-1 sense-transfected lines respond to LPA exposure. (H) Effect of functional PTX or his-C3 exoenzyme on LPA-induced neurite retraction. Sense-expressing clone S-3 was incubated with or without PTX or his-C3 exoenzyme and then analyzed for neurite retraction/cell rounding. Data are the mean ± SEM (n = 4). ∗, P < 0.05 (using Student’s t test) vs. no LPA. #, P < 0.05 vs. 1 μM LPA in nontreated cultures (None). See Experimental Procedures for abbreviations.
Figure 5
VZG-1 expression and LPA exposure activate SREs and increase DNA synthesis through both PTX- and C3-sensitive signaling pathways. (A) Effect of PTX or his-C3 exoenzyme on SRE activation by LPA through VZG-1 expression. Stable B103 cells containing CAT driven by c-fos SREs (clone C-1) were transfected transiently with pHook2 or pHook2/vzg-1, treated without or with PTX or his-C3 exoenzyme, and treated with varying LPA concentrations, and SRE activation determined. Basal CAT expression was 229 ± 36 (pHook2) or 191 ± 20 pg/mg protein (pHook2/vzg-1). Data are expressed as a percentage of maximal response at 1 μM LPA over control (no LPA), the mean ± SEM (n ≥ 4). LPA at 0.1–10 μM significantly increased CAT expression in pHook2/vzg-1-transfected cells (P < 0.05 vs. no LPA using Student’s t test). Both PTX and his-C3 exoenzyme significantly blocked LPA-induced increase in CAT ex-pression (P < 0.05 vs. no treatment with toxins). (B) Effect of PTX or his-C3 exoenzyme on DNA synthesis stimulated by LPA through VZG-1 expression. The S-3 cells were treated without or with PTX or his-C3 exoenzyme and DNA synthesis assayed after 24 h by a 1-h BrdU pulse. Basal percentages of BrdU-incorporated cells were 19.6 ± 1.9 (no treatment), 22.7 ± 2.0 (PTX), or 24.8 ± 1.6% (his-C3). Data are expressed as a percentage of control (no LPA), mean ± SEM (n = 3–6). ∗, P < 0.05 vs. no LPA. #, P < 0.05 (using Student’s t test) vs. 1 μM LPA in nontreated culture.
Figure 6
VZG-1-Mediated responses after LPA stimulation, based on the presented heterologous expression studies.
Similar articles
- Ventricular zone gene-1 (vzg-1) encodes a lysophosphatidic acid receptor expressed in neurogenic regions of the developing cerebral cortex.
Hecht JH, Weiner JA, Post SR, Chun J. Hecht JH, et al. J Cell Biol. 1996 Nov;135(4):1071-83. doi: 10.1083/jcb.135.4.1071. J Cell Biol. 1996. PMID: 8922387 Free PMC article. - Edg-2/Vzg-1 couples to the yeast pheromone response pathway selectively in response to lysophosphatidic acid.
Erickson JR, Wu JJ, Goddard JG, Tigyi G, Kawanishi K, Tomei LD, Kiefer MC. Erickson JR, et al. J Biol Chem. 1998 Jan 16;273(3):1506-10. doi: 10.1074/jbc.273.3.1506. J Biol Chem. 1998. PMID: 9430689 - A growing family of receptor genes for lysophosphatidic acid (LPA) and other lysophospholipids (LPs).
Chun J, Contos JJ, Munroe D. Chun J, et al. Cell Biochem Biophys. 1999;30(2):213-42. doi: 10.1007/BF02738068. Cell Biochem Biophys. 1999. PMID: 10356643 Review. - Stereochemical properties of lysophosphatidic acid receptor activation and metabolism.
Yokoyama K, Baker DL, Virag T, Liliom K, Byun HS, Tigyi G, Bittman R. Yokoyama K, et al. Biochim Biophys Acta. 2002 May 23;1582(1-3):295-308. doi: 10.1016/s1388-1981(02)00184-1. Biochim Biophys Acta. 2002. PMID: 12069841 Review.
Cited by
- Lysophosphatidic acid (LPA) signaling in vertebrate reproduction.
Ye X, Chun J. Ye X, et al. Trends Endocrinol Metab. 2010 Jan;21(1):17-24. doi: 10.1016/j.tem.2009.08.003. Trends Endocrinol Metab. 2010. PMID: 19836970 Free PMC article. Review. - Autotaxin has lysophospholipase D activity leading to tumor cell growth and motility by lysophosphatidic acid production.
Umezu-Goto M, Kishi Y, Taira A, Hama K, Dohmae N, Takio K, Yamori T, Mills GB, Inoue K, Aoki J, Arai H. Umezu-Goto M, et al. J Cell Biol. 2002 Jul 22;158(2):227-33. doi: 10.1083/jcb.200204026. Epub 2002 Jul 15. J Cell Biol. 2002. PMID: 12119361 Free PMC article. - Lysophospholipid receptors in the nervous system.
Toman RE, Spiegel S. Toman RE, et al. Neurochem Res. 2002 Aug;27(7-8):619-27. doi: 10.1023/a:1020219915922. Neurochem Res. 2002. PMID: 12374197 Review. - Regulator of G-protein signalling expression and function in ovarian cancer cell lines.
Hurst JH, Mendpara N, Hooks SB. Hurst JH, et al. Cell Mol Biol Lett. 2009;14(1):153-74. doi: 10.2478/s11658-008-0040-7. Epub 2008 Oct 31. Cell Mol Biol Lett. 2009. PMID: 18979070 Free PMC article.
References
- van Corven E J, Groenink A, Jalink K, Eichholtz T, Moolenaar W H. Cell. 1989;59:45–54. - PubMed
- Ridley A J, Hall A. Cell. 1992;70:389–399. - PubMed
- Hill C S, Wynne J, Treisman R. Cell. 1995;81:1159–1170. - PubMed
- Chuprun J K, Raymond J R, Blackshear P J. J Biol Chem. 1997;272:773–781. - PubMed
Publication types
MeSH terms
Substances
LinkOut - more resources
Full Text Sources
Other Literature Sources
Molecular Biology Databases
Miscellaneous


