Functional specialization and topographic segregation of hippocampal astrocytes - PubMed (original) (raw)
Functional specialization and topographic segregation of hippocampal astrocytes
R D'Ambrosio et al. J Neurosci. 1998.
Abstract
Astrocytes have been suggested to play several roles in the complex control of brain microenvironment. However, they have been generally considered to constitute a homogeneous population of cells. Here we show that at least three electrophysiologically distinct types of astrocytes can be found in the mature hippocampus. These subpopulations of glia were characterized by expression of different ion currents. In astrocytes exposed to elevated K+, Cs+ prevented influx of K+ only in cells with inwardly rectifying currents (IIR). The topographic distribution of glia with Cs+-sensitive inward rectifying currents (involved in K+ buffering) was nonuniform. Cs+-sensitive astrocytes were predominantly found in CA3 radiatum, whereas most CA1 astrocytes were Cs+-insensitive. Functional significance of the spatial segregation of glial cells with inward rectification was addressed in slices that were bathed in Cs+-containing media. Under these conditions, neuronal stimulation induced spontaneous epileptiform activity, which first appeared in CA3 and was then synaptically propagated to CA1. Intracellular labeling of astrocytes with biocytin revealed that CA1 astrocytes are characterized by a high degree of cell-to-cell coupling; in contrast, cell labeling in CA3 revealed smaller groups and occasionally individual cells. Three individual biocytin-labeled cells had electrophysiological properties indistinguishable from Cs+-sensitive astrocytes but had morphology typical of oligodendroglia. These results provide evidence for a role of K+ uptake via IIR into astrocytes. The segregated expression of potassium channels in a subpopulation of astrocytes suggests that functionally specialized cell types are involved in K+ homeostasis.
Figures
Fig. 1.
Passive properties of hippocampal astrocytes.A–C, Resting membrane potential. Whole-cell recordings obtained from 101 astrocytes located in CA1 and CA3 revealed distribution of resting membrane potentials from −81 to −42 mV. RMP values were fitted by a double Gaussian function with peaks at −69 and −51 mV. The range and distribution of RMP were the same for radiatum CA1 astrocytes (B) and for radiatum CA3 astrocytes (C). D–F, Input resistance. The average input resistance of the 101 recorded astrocytes was 117 ± 9 MΩ (D), but CA1 and CA3 RIN values had a different pattern of distribution. CA1 astrocytes had RIN ranging from 15 to 195 MΩ with an average of 76 ± 7 MΩ (E), whereas CA3 astrocytes had a broader distribution of RIN, ranging from 46 to 530 MΩ (mean ± SEM, 142 ± 14 MΩ;F).
Fig. 2.
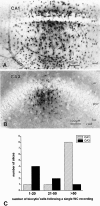
CA1 and CA3 astrocytes have different degrees of cell-to-cell coupling. A, B, Micrographs illustrating typical staining patterns of cells after biocytin injection into a “single” CA1 or CA3 hippocampal astrocyte. A, Labeling an astrocyte in stratum radiatum CA1 typically resulted in staining of hundreds of cells throughout the CA1 region. The dye often spread to stratum lacunosum and moleculare and, through stratum pyramidale, to the stratum oriens. Note that numerous biocytin-positive astrocytes were found distal to the site of injection and in proximity of blood vessels of different caliber. B, Labeling an astrocyte in stratum radiatum of CA3 typically resulted in staining of smaller groups of cells. Biocytin diffused only sparingly to strata moleculare or oriens. C, Number of biocytin-filled astrocytes per injection. CA1 injections yielded no individual cells stained and only two examples in which ≤50 cells were filled with dye. Eight CA1 injections led to widespread (>50 cells) labeling of neighboring astrocytes. In contrast, injections of astrocytes in CA3 yielded labeling of small cell populations. Four injections resulted in labeling of single or pairs of astrocytes, and the other injections stained a small group of cells (21–50). Only one CA3 injection labeled a large group (>50) of cells.
Fig. 3.
Three whole-cell current profiles are recognizable in subpopulations of hippocampal astrocytes. Whole-cell recordings from 92 CA1 and CA3 astrocytes were classified in three categories, according to the profile of the whole-cell current evoked by a ramp voltage command from −170 to +100 mV (750 msec duration; holding potential, −70 mV). A, A complex profile cell was characterized by three points of current rectification (arrows; left panel). The open arrow indicates a region of rectification that depends on time-dependent activation or inactivation of the transient outward current rather than to a pure voltage dependency. An inward rectifier cell was characterized by pronounced inward-going rectification (middle panel), and a linear profile was characterized by an almost perfect ohmic behavior of the whole-cell current (right panel). B, Complex profile astrocytes were also characterized by expression of depolarization-induced transient outward currents (left panel). Recordings from inward rectifier and linear profile astrocytes displayed no transient outward currents (middle, right panels). For these steady-state voltage-clamp experiments, voltage commands consisted of a negative step to −80 mV (holding potential, −70 mV) followed by depolarization in 10 mV increments (inset). C, Inward currents were also differently expressed in linear, inward rectifier, or complex profile glia. Complex cells expressed inward currents displaying strong voltage- and time-dependent inactivation (arrow, left panel). Inward rectifier cells displayed hyperpolarization-activated current characterized by weak time-dependent activation (middle panel), whereas currents in linear cells had little or no time-dependent activation or inactivation (right panel).
Fig. 4.
Complex, inward rectifier, and linear current profile astrocytes are topographically segregated. The majority (82.7%) of CA3 astrocytes expressed inwardly rectifying currents, whereas only 25% of astrocytes in CA1 expressed this property. Conversely, the linear profile type constituted 72.5% of the CA1 astrocytes but represented only 13.5% of the CA3 population. Two CA3 complex cells and one CA1 complex cell had the morphological appearance of oligodendroglia; they are shown separately (see Results).
Fig. 5.
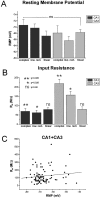
Passive properties of CA3 and CA1 astrocytes.A, Resting membrane potentials were not statistically significantly different in the three subpopulations (based on current profile) of astrocytes in either CA1 or CA3 regions: CA1 complex, −71 ± 3 mV (n = 3); inward rectifier, −69 ± 2 mV (n = 8); linear, −67 ± 2 mV (n = 29); CA3 complex, −68 ± 3 mV (n = 10); inward rectifier, −66 ± 2 mV (n = 32); and linear, −68 ± 2 mV (n = 7). B, Cell input resistance values were significantly lower in CA1 than CA3 astrocytes regardless of current profile. RIN values were, for complex profile cells: CA1, 70 ± 20 MΩ (n = 3); and CA3, 230 ± 20 MΩ (n = 10); for inward rectifier profile cells: CA1, 65 ± 10 MΩ (n = 8); and CA3, 150 ± 30 MΩ, (n = 32); and for linear profile cells: CA1, 75 ± 15 MΩ (n = 29); and CA3, 68 ± 10 MΩ (n = 7).C, There was no significant correlation between cell resting membrane potential and input resistance in hippocampal astrocytes. Fitting of RIN data plotted against RMP gave a slope of 1.63 MΩ/mV.
Fig. 6.
Complex, inward rectifier, and linear astrocytes have different expression of Cs+-sensitive currents. The voltage ramp-evoked whole-cell current profile was highly predictive of an astrocyte’s sensitivity to Cs+.A, Complex cells exhibited large Cs+-sensitive currents. Linear cells, in contrast, displayed little or no Cs+ sensitivity (C). Inward rectifier cells expressed an intermediate level of Cs+-sensitive currents (B). Recordings characterized by high RIN values were obtained from complex, inward rectifier, and linear cells (D–F); biocytin filling revealed that these recordings were obtained from isolated, uncoupled cells (in the CA3 region). D, An isolated complex astrocyte was characterized by large membrane capacitance (25–50 pF), by three points of whole-cell current rectification, and by inward current that was very sensitive to Cs+.E, An inward rectifier cell was characterized by membrane capacitance of 8–10 pF and by Cs+sensitivity intermediate between that of complex cells and linear cells. F, Whole-cell current profile of an astrocyte with a linear profile, which showed dynamic coupling to another cell. The isolated linear astrocyte had capacitance of 7–10 pF and displayed ohmic behavior; the whole-cell current was not affected by Cs+. Voltage commands consisted of ramps from −170 to +100 mV in 750 msec from a holding potential of −70 mV (see Fig.3_A_, inset).
Fig. 7.
Relation between whole-cell current profile and expression of Cs+-sensitive, inwardly rectifying currents. The percentages of Cs+-sensitive currents in complex, inward rectifier, and linear cells are shown for holding membrane potentials of −140 and −90 mV. Bath application of Cs+ (1 m
m
) revealed that complex cells were characterized by a large Cs+-sensitive component (78 ± 13% at −140 mV, 41 ± 5% at −90 mV;n = 7). In contrast, linear profile cells showed a virtual absence of Cs+-sensitive currents (6.5 ± 1% at −140 mV, 3.1 ± 1% at −90 mV; n = 14). Inward rectifier profile cells displayed, on average, an intermediate Cs+ sensitivity (between that of complex and linear cells; 27.3 ± 7% at −140 mV, 24 ± 3.5% at −90 mV; n = 15).
Fig. 8.
Cs+ prevents K+-induced inward currents in complex and inward rectifier cells but not in linear astrocytes. A, left panel, Voltage-clamped astrocytes (−90 mV) exposed to high (12 m
m
) K+ developed inward currents that were blocked by extracellular Cs+ (1 m
m
). Complex cells showed the greatest sensitivity to Cs+ blockade of these currents. Middle panel, Inward currents in inward rectifier astrocytes displayed intermediate Cs+ sensitivity. Right panel, Inward currents elicited by high K+in linear astrocytes were virtually unaffected by Cs+. Bars indicate the time of K+ and/or Cs+ application. Two traces are superimposed, and baselines were zeroed for clarity.B, Statistical comparison of the cumulative data obtained from the experiments illustrated above. Inward rectifier and complex cells were grouped together to emphasize their similar sensitivity to cesium, and percentage of blockade is given for holding membrane potentials of −90 and −100 mV.
Fig. 9.
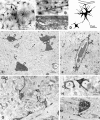
Light and electron microscopy of biocytin-filled astrocytes in the hippocampal CA1 region.A, Biocytin-filled astrocytes (arrows) and their processes in stratum radiatum show random and longitudinal orientation. All astrocytes have primary processes tapering from a large cell body; these processes branch into many fine smooth processes. Astrocytic processes in this region end freely or terminate in end feet onto blood vessels. B, Astrocytes localized close to a blood vessel (BV) with processes forming vascular end feet (arrows).C, Electron micrograph of a gap junction (arrowhead) between cell bodies of two biocytin-filled astrocytes (indicated in E). D, Camera lucida drawing of two coupled astrocytes in the CA1 and subicular region with a vascular end food (arrow) on a capillary; the electrophysiological properties of these cells are shown in Figure 6_F_.E, Low-power electron micrograph from stratum radiatum in the CA1 region, showing biocytin-filled astrocytes (arrows) and their processes (arrowheads). Note two blood vessels (BV) surrounded by astrocytic processes.F, Electron micrograph of a blood vessel (BV), with vascular end feet forming the glial limiting membrane around the blood vessel (arrows). G–I, Electron micrographs of the neuropil, in stratum radiatum, demonstrating biocytin-filled, fine astrocytic processes. These processes form sheath-like profiles and surround synapses (S in G) and small axons (A in H) or are attached to large dendrites (D in G, I).
Fig. 10.
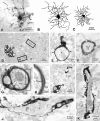
Light and electron microscopy of biocytin-filled complex cells with oligodendrocyte morphology in the hippocampal CA3 region. A–C, Photomicrograph (A) and camera lucida drawings (B, C; B, same cell as in A) of oligodendrocytes. The fine processes of these oligodendrocytes radiate from polygonal cell bodies, are rather more delicate than those of astrocytes, and show periodic swellings (compare with Fig. 9_A–D_). D, Low-power magnification of the neuropil in stratum moleculare in CA3 showing a cross-section of the oligodendrocyte cell body (arrow in_A_) and processes (areas 1, 2).E, Electron micrograph of a biocytin-filled oligodendrocyte’s process, which forms a myelin sheath (arrowheads) around an axon (A).F, A myelinated axon (A) without biocytin is shown for comparison. G, Electron micrograph of a myelinated axon (A) showing the connecting process of the oligodendrocyte (arrows), the external tongue process (T), and the myelin sheath (MS). H, Higher magnification of a portion of the myelin sheath (indicated area in G) demonstrating that the myelin sheath is biocytin-filled. Note the axolemma (A), the lamellae, and outer membrane (OM) of the myelin sheath. I, Higher magnification of a varicosity-like swelling (arrow) of an oligodendrocyte process (area_1_ in D). J, K, Longitudinal sections of myelinated axons (cell in A; area 2 in D) demonstrate biocytin-filled oligodendrocyte processes (arrows) and the surrounding myelin sheaths (arrowheads). Note the different axon diameter and thickness of the myelin sheaths of both axons.
Fig. 11.
Cs+-induced epileptiform activity originates in the CA3 region. Pairing extracellular Cs+ with SC stimulation induces spontaneous activity. The left panel shows the configuration of the recording and stimulating electrodes. Field electrodes were placed in strata pyramidale CA1 and CA3. The stimulating electrode was initially placed in stratum radiatum of CA2. SC stimulation for 15 min at 1 Hz and subsequent stimulation at 0.1 Hz revealed the appearance of spontaneous discharge that was first detected in CA3. A, Panels show the field recordings at 2, 5, and 7 min after 1 Hz stimulation in Cs+; records were taken in the absence of orthodromic stimulation. B, After an increase in spontaneous activity in CA3, synchronized discharges appeared in CA1 radiatum. Asterisks mark stimulus-induced activation. Unstimulated (spontaneous) synchronous activity increased in frequency and appeared simultaneously in both regions (right).C, After SC resection, CA3 retained spontaneous activity (in the absence of stimulation), whereas CA1 become silent (middle, right panels).
Similar articles
- Freshly isolated astrocytes from rat hippocampus show two distinct current patterns and different K(+) uptake capabilities.
Zhou M, Kimelberg HK. Zhou M, et al. J Neurophysiol. 2000 Dec;84(6):2746-57. doi: 10.1152/jn.2000.84.6.2746. J Neurophysiol. 2000. PMID: 11110805 - Postnatal development of ionic currents in rat hippocampal astrocytes in situ.
Bordey A, Sontheimer H. Bordey A, et al. J Neurophysiol. 1997 Jul;78(1):461-77. doi: 10.1152/jn.1997.78.1.461. J Neurophysiol. 1997. PMID: 9242294 - Expression of voltage-activated ion channels by astrocytes and oligodendrocytes in the hippocampal slice.
Sontheimer H, Waxman SG. Sontheimer H, et al. J Neurophysiol. 1993 Nov;70(5):1863-73. doi: 10.1152/jn.1993.70.5.1863. J Neurophysiol. 1993. PMID: 7507520 - Voltage-dependent ion channels in glial cells.
Sontheimer H. Sontheimer H. Glia. 1994 Jun;11(2):156-72. doi: 10.1002/glia.440110210. Glia. 1994. PMID: 7523291 Review. - On the electrical passivity of astrocyte potassium conductance.
Zhou M, Du Y, Aten S, Terman D. Zhou M, et al. J Neurophysiol. 2021 Oct 1;126(4):1403-1419. doi: 10.1152/jn.00330.2021. Epub 2021 Sep 15. J Neurophysiol. 2021. PMID: 34525325 Free PMC article. Review.
Cited by
- Are you in or out? Leukocyte, ion, and neurotransmitter permeability across the epileptic blood-brain barrier.
Janigro D. Janigro D. Epilepsia. 2012 Jun;53 Suppl 1(0 1):26-34. doi: 10.1111/j.1528-1167.2012.03472.x. Epilepsia. 2012. PMID: 22612806 Free PMC article. Review. - Two-pore Domain Potassium Channels in Astrocytes.
Ryoo K, Park JY. Ryoo K, et al. Exp Neurobiol. 2016 Oct;25(5):222-232. doi: 10.5607/en.2016.25.5.222. Epub 2016 Oct 26. Exp Neurobiol. 2016. PMID: 27790056 Free PMC article. Review. - Heavy Alcohol Exposure Activates Astroglial Hemichannels and Pannexons in the Hippocampus of Adolescent Rats: Effects on Neuroinflammation and Astrocyte Arborization.
Gómez GI, Falcon RV, Maturana CJ, Labra VC, Salgado N, Rojas CA, Oyarzun JE, Cerpa W, Quintanilla RA, Orellana JA. Gómez GI, et al. Front Cell Neurosci. 2018 Dec 4;12:472. doi: 10.3389/fncel.2018.00472. eCollection 2018. Front Cell Neurosci. 2018. PMID: 30564103 Free PMC article. - Gap junction-mediated astrocytic networks in the mouse barrel cortex.
Houades V, Koulakoff A, Ezan P, Seif I, Giaume C. Houades V, et al. J Neurosci. 2008 May 14;28(20):5207-17. doi: 10.1523/JNEUROSCI.5100-07.2008. J Neurosci. 2008. PMID: 18480277 Free PMC article.
References
- Bear MF, Malenka RC. Synaptic plasticity: LTP and LTD. Curr Opin Neurobiol. 1994;4:389–399. - PubMed
- Bordey A, Sontheimer H. Postnatal development of ionic currents in rat hippocampal astrocytes in situ. J Neurophysiol. 1997;78:461–477. - PubMed
- Coyle P. Spatial features of the rat hippocampal vascular system. Exp Neurol. 1978;58:549–561. - PubMed
- Czeh G, Aitken PG, Somjen GG. Membrane currents in CA1 pyramidal cells during spreading depression (SD) and SD-like hypoxic depolarization. Brain Res. 1993;632:195–208. - PubMed
Publication types
MeSH terms
Substances
Grants and funding
- NS51614/NS/NINDS NIH HHS/United States
- NS35548/NS/NINDS NIH HHS/United States
- ES07033/ES/NIEHS NIH HHS/United States
- P30 ES007033/ES/NIEHS NIH HHS/United States
- F32 NS010217/NS/NINDS NIH HHS/United States
- R01 HL051614/HL/NHLBI NIH HHS/United States
LinkOut - more resources
Full Text Sources
Miscellaneous


