Functional recovery and enhanced corticofugal plasticity after unilateral pyramidal tract lesion and blockade of myelin-associated neurite growth inhibitors in adult rats - PubMed (original) (raw)
Functional recovery and enhanced corticofugal plasticity after unilateral pyramidal tract lesion and blockade of myelin-associated neurite growth inhibitors in adult rats
W J Z'Graggen et al. J Neurosci. 1998.
Abstract
After a lesion of the mature CNS, structural plasticity and functional recovery are very limited, in contrast to the developing CNS. The postnatal decrease in plasticity is correlated in time with the formation of myelin. To investigate the possible role of an important myelin-associated neurite growth inhibitor (NI-250; IN-1 antigen), one pyramidal tract of adult Lewis rats was lesioned (pyramidotomy), and the rats were treated with the antibody IN-1, a control antibody, or no antibody. Functional recovery was studied from postoperative day 14 until day 42 using a food pellet reaching task, rope climbing, and a grid walk paradigm. The corticofugal projections to the red nucleus and basilar pontine nuclei were analyzed after survival times of 2 and 16 weeks. Treatment with the monoclonal antibody IN-1 resulted in almost complete restoration of skilled forelimb use, whereas all the control groups showed severe and chronic impairments. This functional recovery was paralleled by sprouting of the corticorubral and the corticopontine fibers across the midline, thus establishing a bilateral, anatomically specific projection.
Figures
Fig. 1.
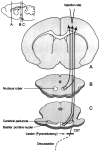
Scheme of the corticofugal projections from the primary motor cortex to the nucleus ruber, to the basilar pontine nuclei, and to the spinal cord with the cortical BDA tracer injection site and the lesion site (arrow). The_insert_ in the top left corner indicates the levels of the cross sections.
Fig. 2.
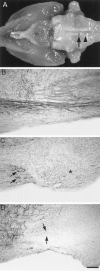
A, Photograph of a brain from ventral illustrating the lesion sites of the first (arrowhead) and second (arrow) pyramidal tract section. B, Photomicrograph of longitudinal section through the caudal medulla oblongata and the lesion site of an unlesioned, control antibody-treated animal after a survival time of 16 weeks showing the intact CST. C, Lesion site of an animal without antibody treatment after a survival time of 16 weeks. Scar tissue has filled in the original lesion site (star). The
Fig. 3.
Food pellet reaching task. Animals were biased to grasp small food pellets with the forelimb contralateral to the lesion, the impaired side, through an opening in the wall of a transparent Plexiglas box.
Fig. 4.
Food pellet reaching task. Quantitative measurements of animals reaching for food at baseline (Preoperative) and 42 d after the lesion (DPO42). A, The time (in seconds) needed to grasp 20 stabilized pellets (s).B, Maximal number of attempts (n) to obtain one stabilized pellet in the 20-pellet paradigm.C, Postoperative time course of maximal number of attempts (n) over variant postoperative days.D, Success rate in grasping 20 stabilized pellets (n = number of pellets grasped and eaten). These results reveal improvements in mAb IN-1-treated animals in quantitative measurements to nearly normal performance levels. AB only, Sham-operated with antibody treatment (n = 8); PT only, lesion without antibody treatment (n = 10);PT+anti-HRP, lesion with control antibody treatment (n = 10); PT+mAb IN-1, lesion with IN-1 antibody treatment (n = 10). Error bars indicate mean ± SEM. Asterisks indicate significances compared with preoperative values: *p< 0.05, **p < 0.01, paired t test or Wilcoxon, respectively.
Fig. 5.
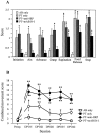
Food pellet reaching task: disability scores. Qualitative analysis of single components comprising a reach for all experimental groups. A, Individual movement categories on postoperative day 42. A score of 0 indicates normal forelimb performance; a score of 3 indicates absent movements (for more detail, see Results). B, Time course of combined scores from baseline (Preoperative) through weekly postoperative intervals (DPO = days postoperative). The qualitative analysis of the reaching movement in mAb IN-1-treated animals shows marked improvement in most movement components. AB only, Sham-operated with antibody treatment (n = 8); PT only, lesion without antibody treatment (n = 10);PT+anti-HRP, lesion with control antibody treatment (n = 10); PT+mAb IN-1, lesion with IN-1 antibody treatment (n = 10). Error bars indicate mean ± SEM. Asterisks indicate significances compared with preoperative values: *p< 0.05, **p < 0.01, Wilcoxon.
Fig. 6.
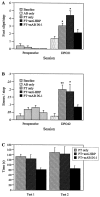
A, Rope climbing. The animals had to climb a vertical rope. The number of foot slips per step was measured at baseline (Preoperative) and 21 d after the lesion (DPO21). This test revealed improved grip strength in mAb IN-1-treated animals as compared with lesioned control groups. B, Grid walk. The ability of the animals to cross a grid with randomly assigned gaps was recorded. The performance was analyzed in the ratio of the number of errors per step at baseline (Preoperative) and 42 d postoperatively (DPO42). Lesioned animals showed improved limb coordination and accurate limb placement after mAb IN-1 treatment.C, Food pellet reaching task. The time to grasp 20 stabilized pellets at day 42 after the first lesion (Test 1) and 4 weeks after relesioning the pyramidal tract slightly rostral to the first lesion site (Test 2). mAb IN-1-treated animals showed no impaired performance after the second lesion. AB only, Sham-operated with antibody treatment (n = 8); PT only, lesion without antibody treatment (n = 10; Fig. 6_C_,n = 4); PT+anti-HRP, lesion with control antibody treatment (n = 10; Fig.6_C_, n = 4); PT+mAb IN-1, lesion with IN-1 antibody treatment (n = 10; Fig. 6_C_:n = 4). Error bars indicate mean ± SEM.Asterisks indicate significances compared with preoperative values: *p < 0.05, **p < 0.01, Wilcoxon.
Fig. 7.
Cross sections of the nucleus ruber.A, Corticofugal projection to the nucleus ruber of a lesioned animal treated with control antibody for 2 weeks. The axons terminate primarily ipsilaterally (large arrow); only a sparse, barely visible contralateral termination exists.B, mAb IN-1-treated animal, 2 weeks after lesion. Significantly more fibers cross the midline and terminate in the contralateral nucleus ruber (small arrows).C, Control antibody-treated animal 16 weeks after pyramidotomy. Only a few fibers cross the midline and innervate the contralateral parvocellular nucleus ruber. D, IN-1 antibody-treated animal after a survival time of 16 weeks. Many axons (arrowhead) crossing the midline and ending in the contralateral red nucleus are seen (small arrows). The contralateral termination fields mirror the ipsilateral side.E, Higher-power photomicrograph of the contralateral parvocellular red nucleus of a control antibody-treated animal (16 weeks). Only a few crossed fibers are present. F, Contralateral nucleus ruber of an IN-1 antibody-treated animal (16 weeks). Many fibers branch and terminate with bouton-like endings in the parvocellular nucleus ruber. Scale bars: A–D, 280 μm; E, F, 70 μm. Magnification: A–D, 35×; E, F, 140×.
Fig. 8.
Number of midline crossing fibers in the area of the parvocellular nucleus ruber divided by the total number of labeled CST fibers, to correct for the differences in the tracing. The_asterisk_ indicates significance (ANOVA;p < 0.05). A, Survival time of 2 weeks. B, Survival time of 16 weeks.
Fig. 9.
Cross sections at midpontine level.A, Control antibody-treated animals 2 weeks after pyramidotomy. BDA-positive fibers leave the cerebral peduncle (cp) ventrally and form typical termination zones, almost completely restricted to the ipsilateral basilar pontine nuclei. Only few fibers end on the contralateral side close to the midline.B, Animal treated with the mAb IN-1 2 weeks after lesion. An increase in the innervation of the contralateral basilar pontine nuclei can be noted (arrows), whereas the ipsilateral side seems unchanged. C, Animal treated with control antibody (16 weeks). D, IN-1 antibody-treated animal (16 weeks). Similar to the findings after 2 weeks, enlarged contralateral termination fields can be observed (arrows). The ipsilateral projection is unchanged.E, Higher-power photomicrograph of Figure2_B_ showing the midline and the ipsilateral (arrowhead) and contralateral (arrow) innervation. F, Crossing fibers (arrowhead) and arborization (arrow) in the contralateral pons of an IN-1 antibody-treated animal after 2 week survival time. Scale bar: A–D, 280 μm;E, 140 μm; F, 70 μm. Magnification:A_–_D, 35×; E, 70×;F, 140×.
Fig. 10.
A, B, Densitometry of the terminal fields of corticopontine projections to the contralateral pons, as percent of the ipsilateral side; survival time of 2 and 16 weeks, respectively. The asterisk indicates significance (ANOVA; p < 0.05). C, D, Densitometry of the ipsilateral corticopontine innervation, divided by the number of fibers after a survival time of 2 or 16 weeks.
Similar articles
- Compensatory sprouting and impulse rerouting after unilateral pyramidal tract lesion in neonatal rats.
Z'Graggen WJ, Fouad K, Raineteau O, Metz GA, Schwab ME, Kartje GL. Z'Graggen WJ, et al. J Neurosci. 2000 Sep 1;20(17):6561-9. doi: 10.1523/JNEUROSCI.20-17-06561.2000. J Neurosci. 2000. PMID: 10964961 Free PMC article. - Neurite growth inhibitors restrict plasticity and functional recovery following corticospinal tract lesions.
Thallmair M, Metz GA, Z'Graggen WJ, Raineteau O, Kartje GL, Schwab ME. Thallmair M, et al. Nat Neurosci. 1998 Jun;1(2):124-31. doi: 10.1038/373. Nat Neurosci. 1998. PMID: 10195127 - Increased corticofugal plasticity after unilateral cortical lesions combined with neutralization of the IN-1 antigen in adult rats.
Wenk CA, Thallmair M, Kartje GL, Schwab ME. Wenk CA, et al. J Comp Neurol. 1999 Jul 19;410(1):143-57. doi: 10.1002/(sici)1096-9861(19990719)410:1<143::aid-cne12>3.0.co;2-#. J Comp Neurol. 1999. PMID: 10397401 - Structural plasticity of the adult CNS. Negative control by neurite growth inhibitory signals.
Schwab ME. Schwab ME. Int J Dev Neurosci. 1996 Jul;14(4):379-85. Int J Dev Neurosci. 1996. PMID: 8884371 Review. - Myelin-associated neurite growth inhibitors: regulators of plastic changes of neural connections in the central nervous system.
Kapfhammer JP. Kapfhammer JP. Prog Brain Res. 1996;108:183-202. doi: 10.1016/s0079-6123(08)62540-6. Prog Brain Res. 1996. PMID: 8979802 Review. No abstract available.
Cited by
- Neuroprotective effects of atomoxetine against traumatic spinal cord injury in rats.
Hou QX, Yu L, Tian SQ, Jiang CJ, Yang WJ, Wang ZJ. Hou QX, et al. Iran J Basic Med Sci. 2016 Mar;19(3):272-80. Iran J Basic Med Sci. 2016. PMID: 27114797 Free PMC article. - Axonal regeneration and functional recovery after complete spinal cord transection in rats by delayed treatment with transplants and neurotrophins.
Coumans JV, Lin TT, Dai HN, MacArthur L, McAtee M, Nash C, Bregman BS. Coumans JV, et al. J Neurosci. 2001 Dec 1;21(23):9334-44. doi: 10.1523/JNEUROSCI.21-23-09334.2001. J Neurosci. 2001. PMID: 11717367 Free PMC article. - Sprouting, regeneration and circuit formation in the injured spinal cord: factors and activity.
Maier IC, Schwab ME. Maier IC, et al. Philos Trans R Soc Lond B Biol Sci. 2006 Sep 29;361(1473):1611-34. doi: 10.1098/rstb.2006.1890. Philos Trans R Soc Lond B Biol Sci. 2006. PMID: 16939978 Free PMC article. Review. - Skilled Movements in Mice Require Inhibition of Corticospinal Axon Collateral Formation in the Spinal Cord by Semaphorin Signaling.
Gu Z, Ueno M, Klinefelter K, Mamidi M, Yagi T, Yoshida Y. Gu Z, et al. J Neurosci. 2019 Nov 6;39(45):8885-8899. doi: 10.1523/JNEUROSCI.2832-18.2019. Epub 2019 Sep 19. J Neurosci. 2019. PMID: 31537704 Free PMC article. - Axonal growth inhibitors and their receptors in spinal cord injury: from biology to clinical translation.
Chambel SS, Cruz CD. Chambel SS, et al. Neural Regen Res. 2023 Dec;18(12):2573-2581. doi: 10.4103/1673-5374.373674. Neural Regen Res. 2023. PMID: 37449592 Free PMC article. Review.
References
- Akintunde A, Buxton DF. Origins and collateralization of corticospinal, corticopontine, corticorubral and corticostriatal tracts: a multiple retrograde fluorescent tracing study. Brain Res. 1992;586:208–218. - PubMed
- Armand J, Kably B. Critical timing of sensorimotor cortex lesions for the recovery of motor skills in the developing cat. Exp Brain Res. 1993;93:73–88. - PubMed
- Brandt HM, Apkarian AV. Biotin-dextran: a sensitive anterograde tracer for neuroanatomic studies in rat and monkey. J Neurosci Methods. 1992;45:35–40. - PubMed
- Bregman BS, Kunkel-Bagden E, Schnell L, Dai HN, Gao D, Schwab ME. Recovery from spinal cord injury mediated by antibodies to neurite growth inhibitors. Nature. 1995;378:498–501. - PubMed
Publication types
MeSH terms
Substances
LinkOut - more resources
Full Text Sources
Other Literature Sources


