The DNA methylation locus DDM1 is required for maintenance of gene silencing in Arabidopsis - PubMed (original) (raw)
The DNA methylation locus DDM1 is required for maintenance of gene silencing in Arabidopsis
J A Jeddeloh et al. Genes Dev. 1998.
Abstract
To investigate the relationship between cytosine methylation and gene silencing in Arabidopsis, we constructed strains containing the ddm1 hypomethylation mutation and a methylated and silenced PAI2 tryptophan biosynthetic gene (MePAI2) that results in a blue fluorescent plant phenotype. The ddm1 mutation had both an immediate and a progressive effect on PAI gene silencing. In the first generation, homozygous ddm1 MePAI2 plants displayed a weakly fluorescent phenotype, in contrast to the strongly fluorescent phenotype of the DDM1 MePAI2 parent. After two generations of inbreeding by self-pollination, the ddm1/ddm1 lines became nonfluorescent. The progressive loss of fluorescence correlated with a progressive loss of methylation from the PAI2 gene. These results indicate that methylation is necessary for maintenance of PAI gene silencing and that intermediate levels of DNA methylation are associated with intermediate gene silencing. The results also support our earlier hypothesis that ddm1 homozygotes act as "epigenetic mutators" by accumulating heritable changes in DNA methylation that can lead to changes in gene expression.
Figures
Figure 1
PAI gene organization. The organization of the four PAI genes in Arabidopsis strain WS is shown. The arrows depict the direction of transcription. The thickness of the lines surrounding each gene reflects the density of cytosine methylation at each locus. The slash indicates that the genes are on the same chromosome but are genetically unlinked.
Figure 2
Genetic pedigrees used to construct Δpai1–pai4 ddm1 double mutants and control lines.
Figure 3
Fluorescence phenotypes of Δpai1–pai4 mutants in different genetic backgrounds. (Left) Genotypes of the plants photographed under short-wave UV (center) and white light (right), respectively.
Figure 4
Quantifying PAI2 gene silencing by measurement of anthranilate compounds. Accumulated anthranilate and anthranilate compounds in leaves of plants with the indicated genotypes were measured spectrofluorometrically. Values were normalized to chlorophyll fluorescence. The histogram displays the mean value for the particular genotype and the standard deviation. (n) The number of independent leaf extractions and quantitations. Five leaves from individual plants were extracted for the control genotypes; two leaves were extracted per individual in the ddm1 segregating family.
Figure 5
ddm1 progressively extinguishes Me-PAI2 silencing. (A) Accumulated anthranilate and anthranilate compounds were measured spectrofluorometrically from leaves of two independent Δpai1–pai4 ddm1 lines (B.1 → B.2 and C.1 → C.2) and a Δpai1–pai4 DDM1 control line (A.1 → A.2) that had been selfed 0–2 generations. Values were normalized to chlorophyll fluorescence as in Fig. 4. Ten leaves from individual plants were extracted in two groups of five leaves for the one and two selfing generation data. Values for the zero selfing generation correspond to the average fluorescence measurement of Δpai1–pai4 ddm1 or DDM1/_ individuals in the segregating family shown in Fig. 4. For the C.1 line, the fluorescence measurements for the two independent five leaf samples were widely disparate and both data points are shown. Such a wide variation presumably reflects a jackpot phenomenon associated with sampling tissues with large sectors. (B) FACS analysis of different Δpai1–pai4 lines (see Materials and methods). Genotypes are indicated at right. The _y_-axis indicates number of cells/particles counted.
Figure 6
ddm1 leads to progressive hypomethylation of PAI2. (A) A restriction map of the WS PAI2 and PAI3 loci. (M) _Msp_I–_Hpa_II; (P) _Pst_I; (* or +) methylated in the Δpai1–pai4 parent (see Materials and Methods). Direction of transcription is indicated by the arrow. Shaded boxes correspond to exons; open boxes correspond to introns. The origin of the hybridization probe used for B–D, a 668-bp _Pst_I fragment from the Col cDNA corresponding to PAI1 (containing 1 single-base difference from PAI2 and 30-single base differences from PAI3), is indicated at the top. (B–D) Genomic Southern blot analysis of ddm1 effects on MspI (M), _Hpa_II (H), and _Pst_I sites (C, D) in PAI2 and PAI3. Genotypes of the Δpai1–pai4 lines are indicated, and the letter designations refer to the specific generations shown in Fig. 2. The origin of the fragments is shown at right: (P2) PAI2; (P3) PAI3. The methylation state of each allele is indicated by the superscripts [all sites marked by an asterisk (*) except for the _Pst_I site directly downstream of the PAI2 coding region which is marked by +], with the number of symbols reflecting the number of methylated sites. (D) Southern analysis of genomic DNA prepared from weakly fluorescent (Weak-Fluor) and nonfluorescent (NonFluor) sectors cut from leaves of five pai ddm1 individuals from line B.1. A novel methylated PAI2 allele (P**+) was seen in the plants used for D, which were planted independently from those used for C.
Figure 7
High-resolution methylation mapping in the PAI2 upstream region shows that ddm1 leads to progressive hypomethylation. The methylation status of cytosines in the PAI2 upstream region was determined by bisulfite DNA sequencing. Approximately 300 bp of double-stranded sequence is shown corresponding to the area surrounding the transcription start site (arrow) of the PAI2 gene. Genotypes of the Δpai1–pai4 lines are indicated (see Fig. 2). Each cytosine on the bottom strand sequence is indicated by a rectangle whose size reflects the number of individual clones sequenced: (A.1) 8 clones; (C.1) 10 clones; (C.2) 8 clones; (REV2) 5 clones. The degree to which each rectangle is filled reflects the methylation occupancy at that site. (•) Cytosines in symmetrical sites; (○) cytosines in nonsymmetrical sites.
Figure 8
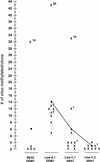
Distribution of cytosine methylation in independent PAI2 clones derived from different Δpai1–pai4 backgrounds. The superscripts on the X’s indicate the number of methylated cytosines at nonsymmetrical sites within the clone. (•) The mean number of methylated cytosines per genotype.
Figure 9
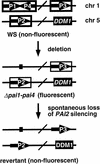
Model for the interaction between DNA methylation and PAI gene silencing. The PAI2 and PAI3 genes in a Δpai1–pai4 mutant background are depicted as in Fig. 1. Dashed boxes around genes indicate intermediate levels of methylation. Loss of MePAI2 silencing can occur by two pathways: (1) a low frequency spontaneous loss of silencing to generate partially fluorescent or nonfluorescent revertant progeny; and (2) _ddm1_-induced progressive loss of silencing at high frequency.
Similar articles
- Maintenance of genomic methylation requires a SWI2/SNF2-like protein.
Jeddeloh JA, Stokes TL, Richards EJ. Jeddeloh JA, et al. Nat Genet. 1999 May;22(1):94-7. doi: 10.1038/8803. Nat Genet. 1999. PMID: 10319870 - Two Arabidopsis methylation-deficiency mutations confer only partial effects on a methylated endogenous gene family.
Bartee L, Bender J. Bartee L, et al. Nucleic Acids Res. 2001 May 15;29(10):2127-34. doi: 10.1093/nar/29.10.2127. Nucleic Acids Res. 2001. PMID: 11353082 Free PMC article. - Heritable epigenetic mutation of a transposon-flanked Arabidopsis gene due to lack of the chromatin-remodeling factor DDM1.
Saze H, Kakutani T. Saze H, et al. EMBO J. 2007 Aug 8;26(15):3641-52. doi: 10.1038/sj.emboj.7601788. Epub 2007 Jul 12. EMBO J. 2007. PMID: 17627280 Free PMC article. - Transcriptional gene silencing mutants.
Mittelsten Scheid O, Paszkowski J. Mittelsten Scheid O, et al. Plant Mol Biol. 2000 Jun;43(2-3):235-41. doi: 10.1023/a:1006487529698. Plant Mol Biol. 2000. PMID: 10999407 Review. - DNA methylation dynamics in plant genomes.
Gehring M, Henikoff S. Gehring M, et al. Biochim Biophys Acta. 2007 May-Jun;1769(5-6):276-86. doi: 10.1016/j.bbaexp.2007.01.009. Epub 2007 Feb 7. Biochim Biophys Acta. 2007. PMID: 17341434 Review.
Cited by
- Transgenerational epigenetic inheritance during plant evolution and breeding.
Cao S, Chen ZJ. Cao S, et al. Trends Plant Sci. 2024 Nov;29(11):1203-1223. doi: 10.1016/j.tplants.2024.04.007. Epub 2024 May 28. Trends Plant Sci. 2024. PMID: 38806375 Review. - Molecular mechanisms and regulation of recombination frequency and distribution in plants.
Zou M, Shabala S, Zhao C, Zhou M. Zou M, et al. Theor Appl Genet. 2024 Mar 21;137(4):86. doi: 10.1007/s00122-024-04590-4. Theor Appl Genet. 2024. PMID: 38512498 Free PMC article. Review. - The plant siRNA landscape.
Vaucheret H, Voinnet O. Vaucheret H, et al. Plant Cell. 2024 Jan 30;36(2):246-275. doi: 10.1093/plcell/koad253. Plant Cell. 2024. PMID: 37772967 Free PMC article. Review. - Chromatin remodeling of histone H3 variants by DDM1 underlies epigenetic inheritance of DNA methylation.
Lee SC, Adams DW, Ipsaro JJ, Cahn J, Lynn J, Kim HS, Berube B, Major V, Calarco JP, LeBlanc C, Bhattacharjee S, Ramu U, Grimanelli D, Jacob Y, Voigt P, Joshua-Tor L, Martienssen RA. Lee SC, et al. Cell. 2023 Sep 14;186(19):4100-4116.e15. doi: 10.1016/j.cell.2023.08.001. Epub 2023 Aug 28. Cell. 2023. PMID: 37643610 Free PMC article. - Chromatin remodeling of histone H3 variants underlies epigenetic inheritance of DNA methylation.
Lee SC, Adams DW, Ipsaro JJ, Cahn J, Lynn J, Kim HS, Berube B, Major V, Calarco JP, LeBlanc C, Bhattacharjee S, Ramu U, Grimanelli D, Jacob Y, Voigt P, Joshua-Tor L, Martienssen RA. Lee SC, et al. bioRxiv [Preprint]. 2023 Aug 2:2023.07.11.548598. doi: 10.1101/2023.07.11.548598. bioRxiv. 2023. PMID: 37503143 Free PMC article. Updated. Preprint.
References
- Allshire RC, Javerzat J-P, Redhead NJ, Cranston G. Position effect variegation at fission yeast centromeres. Cell. 1994;76:157–169. - PubMed
- Aparicio OM, Billington BL, Gottschling DE. Modifiers of position effect are shared between telomeric and silent mating-type loci in S. cerevisiae. Cell. 1991;66:1279–1287. - PubMed
- Ausubel FM, Brent R, Kingston RE, Moore DD, Seidman JG, Smith JA, Struhl K. Current protocols in molecular biology. New York, NY: John Wiley & Sons; 1987.
- Banks JA, Masson P, Fedoroff N. Molecular mechanisms in the developmental regulation of the maize Suppressor-mutator transposable elements. Genes & Dev. 1988;2:1364–1380. - PubMed
- Bender J, Fink GR. Epigenetic control of an endogenous gene family is revealed by a novel blue fluorescent mutant of Arabidopsis. Cell. 1995;83:725–734. - PubMed
Publication types
MeSH terms
Substances
LinkOut - more resources
Full Text Sources
Other Literature Sources
Molecular Biology Databases


