Electrophysiology of the hippocampal and amygdaloid projections to the nucleus accumbens of the rat: convergence, segregation, and interaction of inputs - PubMed (original) (raw)
Electrophysiology of the hippocampal and amygdaloid projections to the nucleus accumbens of the rat: convergence, segregation, and interaction of inputs
A B Mulder et al. J Neurosci. 1998.
Abstract
The nucleus accumbens (Nacb) receives inputs from hippocampus and amygdala but it is still unclear how these inputs are functionally organized and may interact. The interplay between these input pathways was examined using electrophysiological tools in the rat, in vivo, under halothane anesthesia. After fornix/fimbria stimulation (Fo/Fi, subicular projection fibers to the Nacb), mono- and polysynaptically driven single units were recorded in the medial shell/core regions of the Nacb and in the ventromedial caudate putamen. Monosynaptically driven neurons by basolateral amygdala (BLA) stimulation were found in the medial shell/core and in the ventrolateral shell/core regions. In the areas of convergence (medial shell/core), paired activation of BLA followed by that of Fo/Fi resulted in an enhancement of the Fo/Fi response, whereas stimulation in the reverse order, Fo/Fi followed by BLA, led to a depression of the BLA response. In addition to these patterns of interactions, the tetanization of the Fo/Fi to Nacb pathway caused a homosynaptic decremental (long-term) potentiation in the Nacb, accompanied by a heterosynaptic (long-term) depression of the nontetanized BLA to Nacb pathway. We postulate that the hippocampal inputs may close a "gate" for the amygdala inputs, whereas the gate is opened for the hippocampus inputs by previous amygdalar activity. These opposite effects on the Nacb neuronal populations should be taken into account when interpreting behavioral phenomena, particularly with respect to the contrasting effects of the amygdala and the hippocampus in locomotion and place learning.
Figures
Fig. 1.
Evoked responses recorded in the Nacb. Recording in the medial shell and medial core regions of the Nacb resulted in evoked field potentials with positive peak latencies of ∼10 and 22 msec to Fo/Fi stimulation (A1) and negative peak latencies of ∼16 msec to BLA stimulation (B1), whereas in the ventrolateral shell and core regions, on BLA stimulation, EFPs with longer latencies were recorded (C1). In A2, B2, and C2, single traces (bandpass-filtered) show action potentials that coincide with the positive peaks of the Fo/Fi-induced EFP and the negative peaks of the EFP to BLA stimulation. Peristimulus time histograms of the single unit activity to Fo/Fi and BLA stimulation presented in A3, B3, and_C3_ were constructed (64 sweeps). Clearly visible is the peak latency at 9 msec to Fo/Fi stimulation (A3) in the medial shell/core and the 15 msec (B3) and 23 msec (C3) peak latency in medial shell/core and ventrolateral shell/core, respectively, to BLA stimulation. The second peak visible in B3 after 21 msec is attributable to the occurrence of an occasional burst of two action potentials.
Fig. 2.
Distribution of single-unit activity within the Nacb to Fo/Fi and BLA stimulation. The transverse sections are modified from the atlas of Paxinos and Watson (1996). Three sections from rostral to caudal Nacb are presented. Top panels, The boundary between shell and core region (short dashes) was based on Jongen-Rêlo et al. (1994) in which calbindin protein staining was used. The circles represent locations where LTP was elicited in the Nacb to Fo/Fi tetanization. Within the_circles_, the left symbol relates to the Fo/Fi to Nacb pathway, whereas the right symbol is for the BLA to Nacb pathway. ↑, Potentiation; ↓, depression; −, no effect. + indicates the location where PPF was studied. Bottom panels, Monosynaptically (•) and polysynaptically (○) driven single units to Fo/Fi stimulation and monosynaptically driven single units to BLA stimulation (▴) are presented. Single units presenting mono- and polysynaptic responses to Fo/Fi stimulation are also indicated by filled circles. Single units responding to both Fo/Fi and BLA stimulation are indicated by_star-shaped symbols_ (filled, monosynaptically driven by Fo/Fi; open, polysynaptically driven by Fo/Fi). Only Fo/Fi-driven units were found in the dorsal shell and the ventromedial caudate putamen (vm CP), whereas only BLA-driven activity was recorded in the ventrolateral part of the Nacb in both shell and core regions. Single units responding to both stimuli were recorded in the medial shell and medial core regions.
Fig. 3.
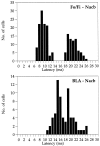
Distribution of the latencies of Nacb single units driven by Fo/Fi and/or by BLA stimulation. Clearly visible are the two distinct latencies at which Fo/Fi-driven neurons could be found that correspond to the two peaks of the evoked field potential P10 and P25. The BLA-driven units display latencies with peaks at 15 and 19 msec. These single units were all found in the medial shell and medial core regions of the Nacb. Neurons displaying latencies of 20 msec and longer to BLA stimulation were found exclusively in the ventrolateral parts of the Nacb in both shell and core.
Fig. 4.
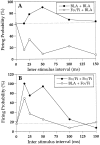
Examples of paired-pulse interactions of the BLA to Nacb and the Fo/Fi to Nacb pathways. Paired-pulse stimulation of the BLA results in paired-pulse facilitation (A). However, when the conditioning pulse is applied to the Fo/Fi fibers and the test pulse is applied in the BLA, the latter is strongly attenuated (A) compared with a single BLA conditioning pulse with the same intensity. Double-pulse stimulation of the Fo/Fi also results in PPF (B). When the conditioning pulse is applied in the BLA followed by the test pulse in the Fo/Fi, the latter response is enhanced compared with a single Fo/Fi conditioning pulse with the same intensity. The _dashed lines_represent the firing probabilities for the conditioning pulses in these experiments.
Fig. 5.
Long-term interaction between the Fo/Fi and the BLA to Nacb pathways after tetanization of the former. LTP in the Fo/Fi to Nacb pathway is presented after a classic tetanus (50 Hz, 2 sec). The tetanic stimulation was given at t = 0. The LTP shows the characteristic initial increase followed by the decremental phase reaching baseline within 60 min as described previously (Boeijinga et al., 1993; Mulder et al., 1993, 1997). The nontetanized BLA to Nacb pathway is depressed (LTD) significantly for 90 min. The_bars_ at the bottom of the graph indicate the level of significance for the post-tetanic values compared with the pretetanic controls. Closed bar, Fo/Fi to Nacb;open bar, BLA to Nacb.
Similar articles
- Responses of the nucleus accumbens following fornix/fimbria stimulation in the rat. Identification and long-term potentiation of mono- and polysynaptic pathways.
Boeijinga PH, Mulder AB, Pennartz CM, Manshanden I, Lopes da Silva FH. Boeijinga PH, et al. Neuroscience. 1993 Apr;53(4):1049-58. doi: 10.1016/0306-4522(93)90488-2. Neuroscience. 1993. PMID: 8389427 - Convergence and interaction of hippocampal and amygdalar projections within the prefrontal cortex in the rat.
Ishikawa A, Nakamura S. Ishikawa A, et al. J Neurosci. 2003 Nov 5;23(31):9987-95. doi: 10.1523/JNEUROSCI.23-31-09987.2003. J Neurosci. 2003. PMID: 14602812 Free PMC article. - Contingent Amygdala Inputs Trigger Heterosynaptic LTP at Hippocampus-To-Accumbens Synapses.
Yu J, Sesack SR, Huang Y, Schlüter OM, Grace AA, Dong Y. Yu J, et al. J Neurosci. 2022 Aug 24;42(34):6581-6592. doi: 10.1523/JNEUROSCI.0838-22.2022. Epub 2022 Jul 15. J Neurosci. 2022. PMID: 35840324 Free PMC article. - Convergence and segregation of ventral striatal inputs and outputs.
Groenewegen HJ, Wright CI, Beijer AV, Voorn P. Groenewegen HJ, et al. Ann N Y Acad Sci. 1999 Jun 29;877:49-63. doi: 10.1111/j.1749-6632.1999.tb09260.x. Ann N Y Acad Sci. 1999. PMID: 10415642 Review. - Modulation of hippocampal long-term potentiation by the amygdala: a synaptic mechanism linking emotion and memory.
Abe K. Abe K. Jpn J Pharmacol. 2001 May;86(1):18-22. doi: 10.1254/jjp.86.18. Jpn J Pharmacol. 2001. PMID: 11430468 Review.
Cited by
- Basolateral amygdala noradrenergic influence enables enhancement of memory consolidation induced by hippocampal glucocorticoid receptor activation.
Roozendaal B, Nguyen BT, Power AE, McGaugh JL. Roozendaal B, et al. Proc Natl Acad Sci U S A. 1999 Sep 28;96(20):11642-7. doi: 10.1073/pnas.96.20.11642. Proc Natl Acad Sci U S A. 1999. PMID: 10500230 Free PMC article. - The neuroscience of natural rewards: relevance to addictive drugs.
Kelley AE, Berridge KC. Kelley AE, et al. J Neurosci. 2002 May 1;22(9):3306-11. doi: 10.1523/JNEUROSCI.22-09-03306.2002. J Neurosci. 2002. PMID: 11978804 Free PMC article. Review. No abstract available. - Cannabinoid receptor activation prevents the effects of chronic mild stress on emotional learning and LTP in a rat model of depression.
Segev A, Rubin AS, Abush H, Richter-Levin G, Akirav I. Segev A, et al. Neuropsychopharmacology. 2014 Mar;39(4):919-33. doi: 10.1038/npp.2013.292. Epub 2013 Oct 21. Neuropsychopharmacology. 2014. PMID: 24141570 Free PMC article. - Amygdalostriatal projections in the neurocircuitry for motivation: a neuroanatomical thread through the career of Ann Kelley.
Zorrilla EP, Koob GF. Zorrilla EP, et al. Neurosci Biobehav Rev. 2013 Nov;37(9 Pt A):1932-45. doi: 10.1016/j.neubiorev.2012.11.019. Epub 2012 Dec 7. Neurosci Biobehav Rev. 2013. PMID: 23220696 Free PMC article. Review. - Involvement of the endogenous cannabinoid system in the effects of alcohol in the mesolimbic reward circuit: electrophysiological evidence in vivo.
Perra S, Pillolla G, Melis M, Muntoni AL, Gessa GL, Pistis M. Perra S, et al. Psychopharmacology (Berl). 2005 Dec;183(3):368-77. doi: 10.1007/s00213-005-0195-0. Epub 2005 Oct 15. Psychopharmacology (Berl). 2005. PMID: 16228194
References
- Abraham WC, Goddard GV. Asymmetric relationships between homosynaptic long-term potentiation and heterosynaptic long-term depression. Nature. 1983;305:717–719. - PubMed
- Arts MPM, Groenewegen HJ. Relationships of the dendritic arborations of ventral striatomesencephalic projection neurons with boundaries of striatal compartments. An in vitro intracellular labelling study in the rat. Eur J Neurosci. 1992;4:574–588. - PubMed
Publication types
MeSH terms
LinkOut - more resources
Full Text Sources


